Dashboards: Session 1 - Wed 4/5/23 [SPECIAL - Dashboard Studio Challenge]
Join the Conversation
- News & Events
- :
- Events and Contests
- :
- Office Hours: Ask the Experts
- :
- Community Office Hours
- :
- Dashboards: Session 1 - Wed 4/5/23 [SPECIAL - Dash...
- Subscribe to Topic
- Mark as read
- Mark as new
Dashboards: Session 1 - Wed 4/5/23 [SPECIAL - Dashboard Studio Challenge]

Join this SPECIAL Office Hours session for Dashboard Studio Challenge participants. Submit your questions below for the session on Wed, April 5, 2023 at 1pm PT / 4pm ET.
Register here to join the zoom session. This is your chance to ask the Dashboard Studio Team questions and get live, hands-on help with your dashboard before your final submission.
The Dashboard Studio Challenge is an opportunity to level up your dashboard skills, showcase your visualizations, and win a $100 gift card to the Splunk Store.
Please submit your questions below as comments in advance. You can also head to the #office-hours user Slack channel to ask questions (request access here).
Pre-submitted questions with upvotes will be prioritized. After that, we will go in order of the questions posted below, then will open the floor up to live Q&A with meeting participants. If there’s a quick answer available, we’ll post as a direct reply.
Look forward to connecting!
- Mark as New
- Bookmark Message
- Subscribe to Message
- Mute Message
- Subscribe to RSS Feed
- Permalink
Hey Everyone!
Drop your questions/comments here for any topics you'd like to see discussed in the Community Office Hours session (you can also head to the #office-hours user Slack channel to ask questions and join the discussion - request access here).
- Mark as New
- Bookmark Message
- Subscribe to Message
- Mute Message
- Subscribe to RSS Feed
- Permalink
Office Hours Q&A
Q1: I'm pretty new to dashboard studio and am interested in this demo because I found it very different from classic dashboarding and is very challenging. Would like to know everything from scratch
- A: Watch this YouTube Demo and follow this Step by Step Tutorial to get started with Dashboard Studio!
Q2: The Dashboard Studio Examples Hub reminds me of ITSI, is there a similarity?
- A: The underlying library that we're using to generate the dashboards and render the dashboards in Dashboard Studio is a Splunk developed library that is used both in dashboard studio and ITSI, and that's why you see a lot of similarities.
- But the implementation and features are not exactly the same. So in Dashboard Studio, we've implemented certain features that are intended to be a little bit more generic. In ITSI, they've implemented some additional features on top of that library that are very specific to the use cases that you may need an it operation.
Q3: How are we supposed to use the datasets that you shared for the Challenge? Is there a sandbox environment or a test environment for us to practice on?
- A: If you don’t want to use your own environment, you can go ahead and download a free trial of Splunk Cloud Platform (encouraged for access to the newest features) or you can also download Splunk Enterprise for free.
Q4: Can you go over drilldowns?
- A: Check out the drilldown step-by-step documentation (see full demo recording posted in the #office-hours Slack channel w/ Q&A slide deck).
- Mark as New
- Bookmark Message
- Subscribe to Message
- Mute Message
- Subscribe to RSS Feed
- Permalink
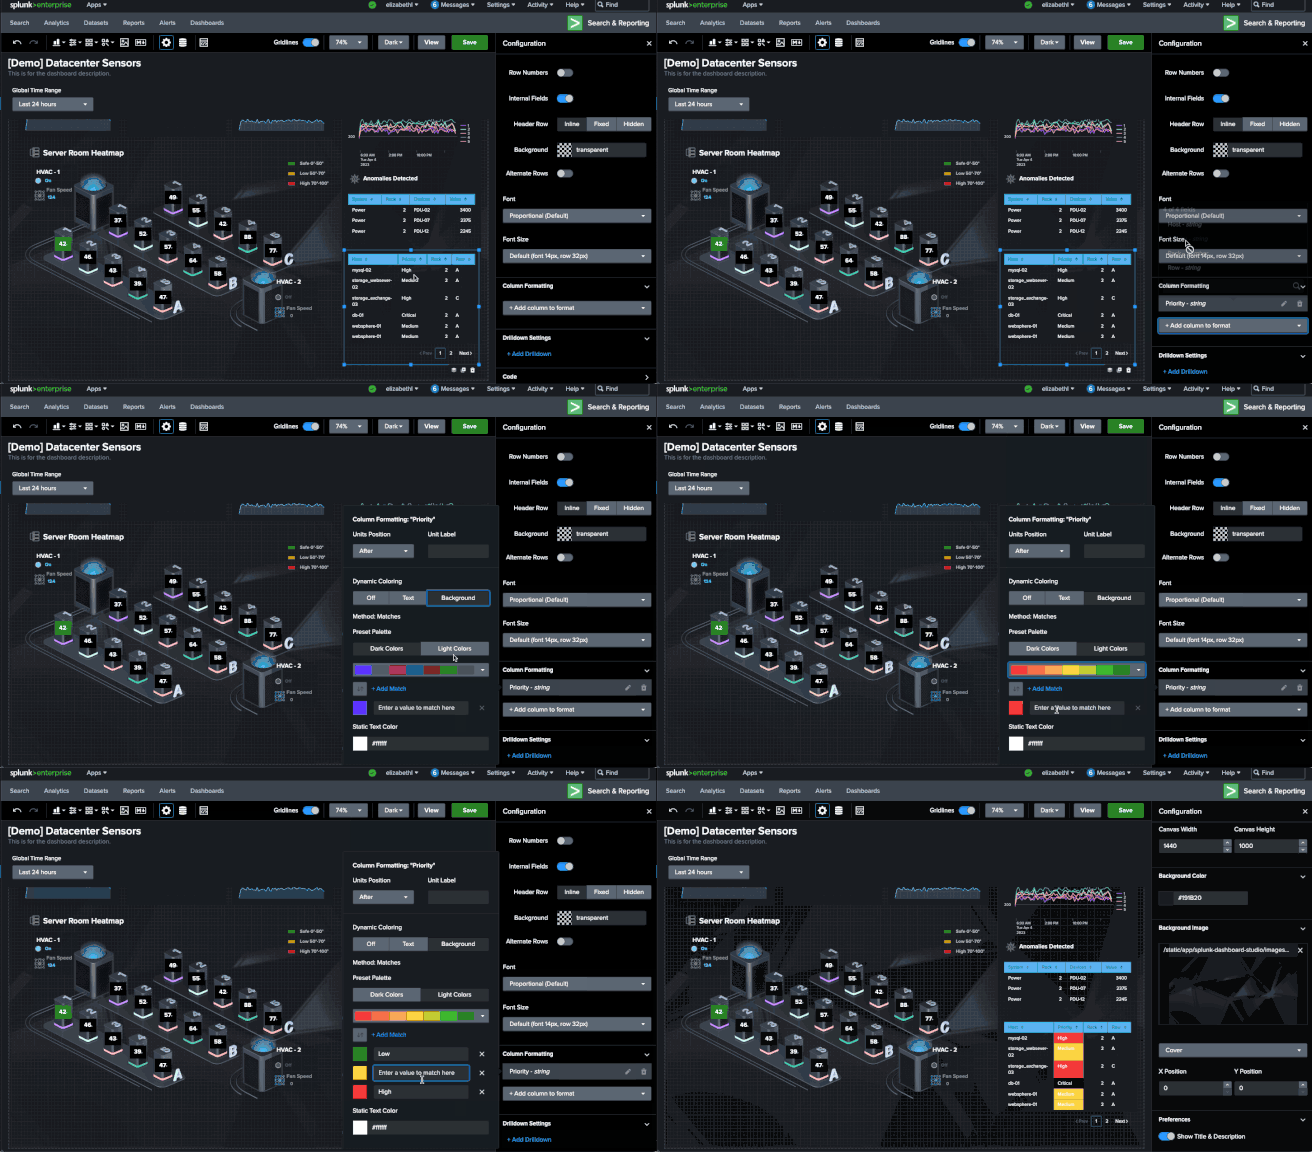
Q: How do I color a table cell based on string values?
If you're on the latest version of Splunk Cloud (9.0.2209) you can use the configuration UI - this will allow you to specify particular strings and specify the color that you want (you can see it's happening with the green, yellow, and red):
If your version of Splunk doesn't have the UI, you can still color based on string values, by modifying source code. You can also look for examples of this in our Examples Hub.
 "options": {
       "tableFormat": {},
       "columnFormat": {
           "Priority": {
               "data": "> table | seriesByName(\"Priority\") | formatByType(PriorityColumnFormatEditorConfig)",
               "rowColors": "> table | seriesByName('Priority') | pick(PriorityRowColorsEditorConfig)",
               "rowBackgroundColors": "> table | seriesByName(\"Priority\") | matchValue(PriorityRowBackgroundColorsEditorConfig)"
           }
       }
   },
   "context": {
       "PriorityRowBackgroundColorsEditorConfig": [
           {
               "match": "High",
               "value": "#FE3A3A"
           },
           {
               "match": "Medium",
               "value": "#FFD442"
           },
           {
               "match": "Low",
               "value": "#088F44"
           }
       ]
   },
}

