Join the Conversation
- Find Answers
- :
- Using Splunk
- :
- Dashboards & Visualizations
- :
- How to change the dislay value in graph
- Subscribe to RSS Feed
- Mark Topic as New
- Mark Topic as Read
- Float this Topic for Current User
- Bookmark Topic
- Subscribe to Topic
- Mute Topic
- Printer Friendly Page
- Mark as New
- Bookmark Message
- Subscribe to Message
- Mute Message
- Subscribe to RSS Feed
- Permalink
- Report Inappropriate Content
How to change the dislay value in graph
I have text data which contains the status . Converted TEXT to number to plot bar graph .
But in display I want to show the actual status values.
Sample Data
Status may contain --> CONNECT/DISCONNECT
Assigned CONNECT=0 and DISCONNECT to 1 to plot bar graph
Now in bar chart it is displaying 0(or1), but I want it to display actual values (CONNECT/DISCONNECT)
- Mark as New
- Bookmark Message
- Subscribe to Message
- Mute Message
- Subscribe to RSS Feed
- Permalink
- Report Inappropriate Content
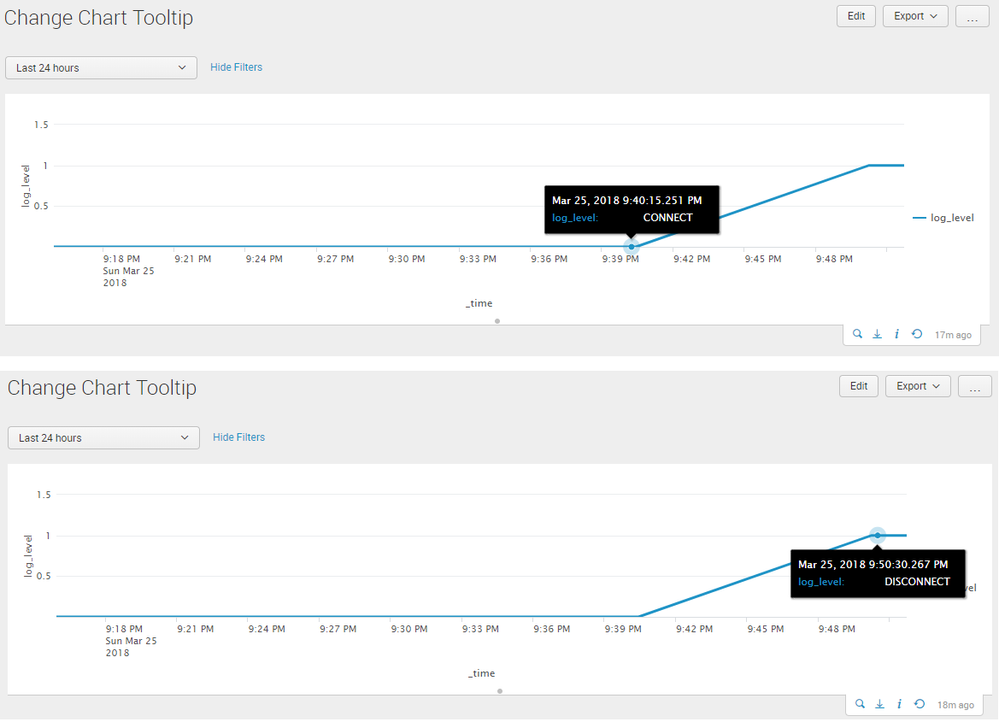
Hi @chvenu17, Simple XML JavaScript Extension would be your only option if you are on Splunk 6.5. Since you just need Tooltip Text 0 and 1 to be replaced with CONNECT and DISCONNECT respectively you will have JavaScript to parse to Tooltip node with the tooltip text. This has to be done while mouse hovering over the series plotted on the chart.
Following is a runanywhere Simple XML dashboard which plots the series for Log Level as 0 and 1 on timechart. The root node <form>/<dashboard> has JavaScript file included i.e. modify_tooltip_text.js to apply the JavaScript extension as per use case.
<form script="modify_tooltip_text.js">
  <label>Change Chart Tooltip</label>
  <fieldset submitButton="false">
    <input type="time" token="tokTime" searchWhenChanged="true">
      <label></label>
      <default>
        <earliest>-24h@h</earliest>
        <latest>now</latest>
      </default>
    </input>
  </fieldset>
  <row>
    <panel>
      <html>
        <style>
          #mychart table.highcharts-tooltip tbody tr:last-child td:last-child{
            position: relative !important;
            left: -30% !important;
          }
        </style>
      </html>
      <chart id="mychart">
        <search>
          <query>index=_internal sourcetype=splunkd log_level!="INFO" component="Search*"
| eval log_level=if(log_level="ERROR",0,1)
| table _time log_level</query>
          <earliest>$tokTime.earliest$</earliest>
          <latest>$tokTime.latest$</latest>
          <sampleRatio>1</sampleRatio>
        </search>
        <option name="charting.axisLabelsX.majorLabelStyle.overflowMode">ellipsisNone</option>
        <option name="charting.axisLabelsX.majorLabelStyle.rotation">0</option>
        <option name="charting.axisTitleX.visibility">visible</option>
        <option name="charting.axisTitleY.visibility">visible</option>
        <option name="charting.axisTitleY2.visibility">visible</option>
        <option name="charting.axisX.abbreviation">none</option>
        <option name="charting.axisX.scale">linear</option>
        <option name="charting.axisY.abbreviation">none</option>
        <option name="charting.axisY.scale">linear</option>
        <option name="charting.axisY2.abbreviation">none</option>
        <option name="charting.axisY2.enabled">0</option>
        <option name="charting.axisY2.scale">inherit</option>
        <option name="charting.chart">line</option>
        <option name="charting.chart.bubbleMaximumSize">50</option>
        <option name="charting.chart.bubbleMinimumSize">10</option>
        <option name="charting.chart.bubbleSizeBy">area</option>
        <option name="charting.chart.nullValueMode">gaps</option>
        <option name="charting.chart.showDataLabels">none</option>
        <option name="charting.chart.sliceCollapsingThreshold">0.01</option>
        <option name="charting.chart.stackMode">default</option>
        <option name="charting.chart.style">shiny</option>
        <option name="charting.drilldown">none</option>
        <option name="charting.layout.splitSeries">0</option>
        <option name="charting.layout.splitSeries.allowIndependentYRanges">0</option>
        <option name="charting.legend.labelStyle.overflowMode">ellipsisMiddle</option>
        <option name="charting.legend.mode">standard</option>
        <option name="charting.legend.placement">right</option>
        <option name="charting.lineWidth">2</option>
        <option name="refresh.display">progressbar</option>
        <option name="trellis.enabled">0</option>
        <option name="trellis.scales.shared">1</option>
        <option name="trellis.size">medium</option>
      </chart>
    </panel>
  </row>
</form>
Following is the code for modify_tooltip_text.js JavaScript file which needs to be placed under $SPLUNK_HOME/etc/apps/<yourAppName>/appserver/static folder. If appserver/static folder does not exist you might have to create it.
You might have to restart/refresh/bump Splunk for static files related changes to reflect in Splunk. Also you might have to clear your internet browser history.
 require([
 "jquery",
 "splunkjs/mvc",
 "splunkjs/mvc/simplexml/ready!"
          ], function($) {
    $(document).on("mouseover","#mychart g.highcharts-series-group > g.highcharts-series-hover",function(){
        setTimeout(function(){
            var tooltip_int=$(".highcharts-tooltip tbody tr:last-child td:last-child").text();
            console.log("tooltip_int:",tooltip_int);
            var tooltip_int=parseInt(tooltip_int);
            if (tooltip_int===0) {
                $(".highcharts-tooltip tbody tr:last-child td:last-child").html("CONNECT");
                console.log("0-CONNECT");
            } else if (tooltip_int===1){
                $(".highcharts-tooltip tbody tr:last-child td:last-child").html("DISCONNECT");
                console.log("1-DISCONNECT");
            }
        }, 10);
    });
});
PS: You might not need setTimeOut() as a delay seems to be required only for version 6.6. or above. Refer to answer https://answers.splunk.com/answers/614788/splunk-dashboard-examples-table-row-highlighting-b.html
If you need to pick up on Simple XML JS Extension you should check out Splunk Dashboard Examples app and also read about Splunk Web Framework on Splunk Dev site.
| makeresults | eval message= "Happy Splunking!!!"
- Mark as New
- Bookmark Message
- Subscribe to Message
- Mute Message
- Subscribe to RSS Feed
- Permalink
- Report Inappropriate Content
Thanks for your detailed answer. I will try use it and mark the answer as accepted
- Mark as New
- Bookmark Message
- Subscribe to Message
- Mute Message
- Subscribe to RSS Feed
- Permalink
- Report Inappropriate Content
@chvenu17 if you are on Splunk Enterprise 7.0 you can use Event Annotations. If you are on any previous version you can add Status in Tooltip Text to be displayed in your Chart on mouse hover. Refer to the following answer with the links to both approach.
https://answers.splunk.com/answers/613705/using-dashboard-for-presentation.html
| makeresults | eval message= "Happy Splunking!!!"
- Mark as New
- Bookmark Message
- Subscribe to Message
- Mute Message
- Subscribe to RSS Feed
- Permalink
- Report Inappropriate Content
Thanks for quick reply. My splunk is running on 6.5.2 and seems to bit complex to implement (at least for me as I am only three days old to splunk)

