Are you a member of the Splunk Community?
- Find Answers
- :
- Apps & Add-ons
- :
- All Apps and Add-ons
- :
- app or add-on for IBM Aspera HSTS?
- Subscribe to RSS Feed
- Mark Topic as New
- Mark Topic as Read
- Float this Topic for Current User
- Bookmark Topic
- Subscribe to Topic
- Mute Topic
- Printer Friendly Page
- Mark as New
- Bookmark Message
- Subscribe to Message
- Mute Message
- Subscribe to RSS Feed
- Permalink
- Report Inappropriate Content
app or add-on for IBM Aspera HSTS?
Would anyone be willing to partner with me on creating a Splunk add-on or an app, for IBM Aspera HSTS (High Speed Transfer Server, formerly "Enterprise Server")?
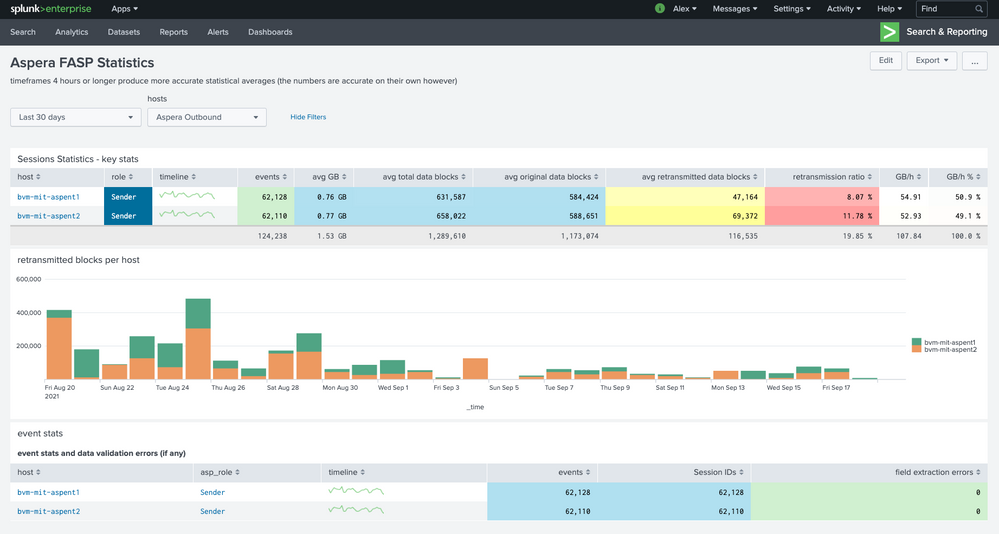
I've spent a couple of years writing arcane SPL to extract KVs and create dashboards like this - but am rather clueless about how to make that knowledge useful to others and formalize what I learned into an add-on or an app. I am assuming the first step is create a CIM, and then create an add-on around that CIM - yet like I said, I am mostly clueless about it.
Here is what I have:
- lots of logs (a few GBs) from a couple Windows Aspera server in my team
- a few ad-hoc dashboards full of regex-based queries doing KV extraction (quite a few were done with amazing @to4kawa's help)
- IBM's unofficial guide to deciphering their logs
- time and energy to test and tune an app and to continuously collaborate on it:)
I'd be very grateful for any help! (If you're willing to help, no prior Aspera HSTS knowledge is needed - only knowledge on how to craft apps and add-ons.)
Thanks!
P.S. The potential user base for such an app or add-on does not seem to be huge - yet the software is quite popular and there doesn't seem to be much of an effort to create appropriate CIMs or add-ons for it.
- Mark as New
- Bookmark Message
- Subscribe to Message
- Mute Message
- Subscribe to RSS Feed
- Permalink
- Report Inappropriate Content
Hi mitag,
its been a while since you posted this. Were you able to work on such an app / add-on? I would be interested in it.
- Mark as New
- Bookmark Message
- Subscribe to Message
- Mute Message
- Subscribe to RSS Feed
- Permalink
- Report Inappropriate Content
P.P.S. Quite a few good operational / observability questions that can be answered with such an app or an add-on - i.e. there's a good business case for it:
- which sources or targets (aka "partners") have the highest error and failure rates, slowest transfer rates? How have these metrics changed over time?
- a realtime dashboard of transfers in progress, with ETCs (estimated times of completion), error rates, other stats
- flag failures and errors that could be on our side, potentially due to application errors or resource exhaustion
- capacity planning (are our aspera servers right-sized? when will we need to upgrade or scale them, if ever?)
- etc...

