- Apps & Add-ons
- :
- All Apps and Add-ons
- :
- All Apps and Add-ons
- :
- Re: Upgraded Splunk DB Connect V3.2.0 to V3.3.0 se...
- Subscribe to RSS Feed
- Mark Topic as New
- Mark Topic as Read
- Float this Topic for Current User
- Bookmark Topic
- Subscribe to Topic
- Mute Topic
- Printer Friendly Page
- Mark as New
- Bookmark Message
- Subscribe to Message
- Mute Message
- Subscribe to RSS Feed
- Permalink
- Report Inappropriate Content
Why is upgraded Splunk DB Connect V3.2.0 to V3.3.0 seeing metrics-logger-reporter errors?
Hi,
I upgraded Splunk DB Connect from V3.2.0 to V3.3.0 and now see lots of errors like this. Anyone know what this is, or what I can do about it? (Rolled back to V3.2.0 for now).
(Splunk version 8.0.1)
Thanks,
Paul
04-06-2020 17:41:42.379 +0000 ERROR ExecProcessor - message from "/opt/apps/splunk/etc/apps/splunk_app_db_connect/linux_x86_64/bin/dbxquery.sh" 17:41:42.378 [metrics-logger-reporter-1-thread-1] INFO c.s.d.c.h.i.ConnectionPoolMetricsLogReporter - type=TIMER, name=unnamed_pool_82649329_jdbc_mysql//pie1applicationdatabases-agenacluster-.cluster-ro-.us-west-2.rds.amazonaws.com3306/agena_pie1?useSSL_true.pool.Wait, count=18, min=0.011064, max=21.322425, mean=5.69591799641126, stddev=8.099832751566446, p50=0.011469, p75=17.237046, p95=17.237046, p98=17.237046, p99=17.237046, p999=17.237046, m1_rate=9.818194454345773E-23, m5_rate=7.220013689967951E-7, m15_rate=1.3879932839497408E-4, mean_rate=2.525958496499233E-4, rate_unit=events/second, duration_unit=milliseconds
- Mark as New
- Bookmark Message
- Subscribe to Message
- Mute Message
- Subscribe to RSS Feed
- Permalink
- Report Inappropriate Content
Thanks to everyone that tried to help here. Unfortunately none of the suggestions worked for me, but they showed me where to look.
But I gave it one more attempt to go from 3.2.0 to 3.7.0
At first I had the same problem, but the fix (for me) was to make sure that all the debug was set to WARN on the deployer before copying it to the shcluster folder and deploying it. Strange that this would matter, given that the deployed version was all set to WARN, but this fixed it.
phunte
- Mark as New
- Bookmark Message
- Subscribe to Message
- Mute Message
- Subscribe to RSS Feed
- Permalink
- Report Inappropriate Content
These information is from splunk_app_db_connect_health_metrics.log. Generally DBX print logs, and splunk redirect them to splunkd.log. Not sure if DBX prints them in stderr incorrectly, or splunk handle it incorrectly. Will check with Core team and keep posted.
- Mark as New
- Bookmark Message
- Subscribe to Message
- Mute Message
- Subscribe to RSS Feed
- Permalink
- Report Inappropriate Content
1. "ERROR ExecProcessor" is generated from splunkd, whereas "[metrics-logger-reporter-1-thread-1] INFO" is generated from DBX with log level INFO, this is by design.
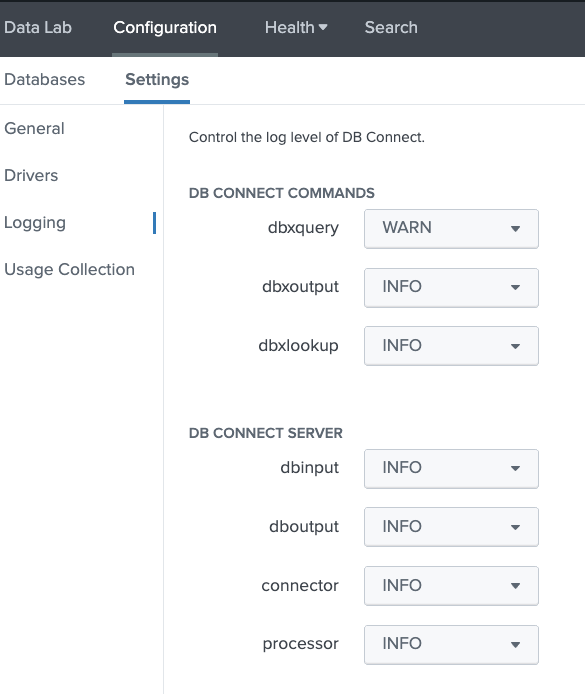
2. Another workaround we can have is to setup the log level to WARN or ERROR, to eliminate DBX INFO logs through DBX UI
- Mark as New
- Bookmark Message
- Subscribe to Message
- Mute Message
- Subscribe to RSS Feed
- Permalink
- Report Inappropriate Content
We are having the same issue on Splunk Enterprise 9 and DB Connect 3.7.0.
Is there another way to workaround this issue without changing the logging settings?
Any ETA on a fix for the Splunk DB Connect app?
- Mark as New
- Bookmark Message
- Subscribe to Message
- Mute Message
- Subscribe to RSS Feed
- Permalink
- Report Inappropriate Content
worked for me, thanks!
- Mark as New
- Bookmark Message
- Subscribe to Message
- Mute Message
- Subscribe to RSS Feed
- Permalink
- Report Inappropriate Content
In my case this was resolved by clicking the Reset and Save buttons on the Configuration > Settings > Logging page in the DB Connect App and restarting Splunk.
The Reset button created and/or updated the following two files.
- splunk_app_db_connect/bin/dbx2/rest/__pycache__/loglevel.cpython-37.pyc
- splunk_app_db_connect/bin/__pycache__/dbx_rh_loglevel.cpython-37.pyc
The Save button created or updated the follwing files
- splunk_app_db_connect/jars/server.vmopts
- splunk_app_db_connect/jars/dbxquery.vmopts
- splunk_app_db_connect/local/dbx_settings.conf
- splunk_app_db_connect/metadata/local.meta
- Mark as New
- Bookmark Message
- Subscribe to Message
- Mute Message
- Subscribe to RSS Feed
- Permalink
- Report Inappropriate Content
This worked for us.
- Mark as New
- Bookmark Message
- Subscribe to Message
- Mute Message
- Subscribe to RSS Feed
- Permalink
- Report Inappropriate Content
If your upgrading from a previous version of DBX make sure you remove commands.conf from /local I was having issues ready to pull out my hair and finally figured this one out.
- Mark as New
- Bookmark Message
- Subscribe to Message
- Mute Message
- Subscribe to RSS Feed
- Permalink
- Report Inappropriate Content
Same error here.
- Mark as New
- Bookmark Message
- Subscribe to Message
- Mute Message
- Subscribe to RSS Feed
- Permalink
- Report Inappropriate Content
I am having same issue. Does anyone has found why this is happening and resolution to this?

