Are you a member of the Splunk Community?
- Find Answers
- :
- Apps & Add-ons
- :
- All Apps and Add-ons
- :
- Timeline - Custom Visualization: How to properly g...
- Subscribe to RSS Feed
- Mark Topic as New
- Mark Topic as Read
- Float this Topic for Current User
- Bookmark Topic
- Subscribe to Topic
- Mute Topic
- Printer Friendly Page
- Mark as New
- Bookmark Message
- Subscribe to Message
- Mute Message
- Subscribe to RSS Feed
- Permalink
- Report Inappropriate Content
I'm trying to create a timeline visualization based off of the DATETIME and JOBNAME these two logs:
 DATETIME:   2017-07-11 08:04:06.99 -0700
 JOBNAME:    CIBI825D
 MSGTXT:     IEF404I CIBI825D - ENDED - TIME=08.04.06


 DATETIME:   2017-07-11 06:53:40.50 -0700
 JOBNAME:    CIBI825D
 MSGTXT:     IEF403I CIBI825D - STARTED - TIME=06.53.40
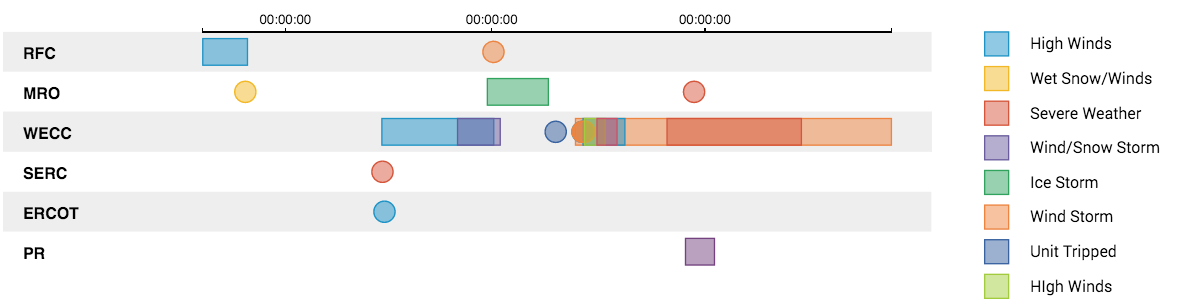
I can currently show start/end times as points but I'm unable to graph them as a range of time using the duration_field as noted in the documentation. The below documentation link shows that I'm trying to achieve: Row RFC, blue block
I'm able to create the timeline visualization with the simple query below to get the start and end point graphed.
index = x MSGTXT = "\*started - time\*" OR "\*ended - time\*"
| regex JOBNAME = "CIBI825D"

| table DATETIME JOBNAME

The splunk documentation for timeline visualization shows that I need the starttime and duration so here is the query I came up with to get the duration.
index = x MSGTXT = "\*started - time\*" OR "\*ended - time\*"
| regex JOBNAME = "CIBI825D"
| rex field=DATETIME "(?<time>[^\r\n]+)"
| eval time=strptime(time, "%Y-%m-%d %H:%M:%S")
| stats range(time) AS duration BY JOBNAME

| append[search
index = x  MSGTXT = "*started - time*"
| regex JOBNAME = "CIBI825D"
| rex field=DATETIME "(?<STARTTIME>[^\r\n]+)"
| eval STIME=strptime(STARTTIME, "%Y-%m-%d %H:%M:%S")
    ]

|table STARTTIME JOBNAME duration
Here is the picture of what it looks like. I'm not sure why it isn't working. I tried to convert seconds to milliseconds like the documentation says but that doesn't work as well.

Also, as a followup question, after this I would like do combine multiple JOBNAMES to show multiple ranges on a single row. Is this possible? If yes, how would I do that?
- Mark as New
- Bookmark Message
- Subscribe to Message
- Mute Message
- Subscribe to RSS Feed
- Permalink
- Report Inappropriate Content
@Toshbar, if you have ingested your data with valid timestamp recognition, ideally you should have _time field extracted from pattern DATETIME:
| makeresults
| eval _raw = "DATETIME:     2017-07-11 08:04:06.99 -0700    JOBNAME:     CIBI825D    MSGTXT:     IEF404I CIBI825D - ENDED - TIME=08.04.06"
| eval _time = strptime("2017-07-11 08:04:06.99 -0700","%Y-%m-%d %H:%M:%S")
| append [| makeresults
          | eval _raw = "DATETIME:     2017-07-11 06:53:40.50 -0700    JOBNAME:     CIBI825D    MSGTXT:     IEF403I CIBI825D - STARTED - TIME=06.53.40 "
          | eval _time = strptime("2017-07-11 06:53:40.50 -0700","%Y-%m-%d %H:%M:%S")]
The above is to generate sample data. Following is to generate required table for plotting duration by Job Name on Timeline custom visualization.
| rex field=_raw "JOBNAME:\s+(?<JOBNAME>\w+)\s+"
| stats min(_time) as _time max(_time) as ENDTIME by JOBNAME
| eval duration=ENDTIME-_time
| table _time JOBNAME duration
| makeresults | eval message= "Happy Splunking!!!"
- Mark as New
- Bookmark Message
- Subscribe to Message
- Mute Message
- Subscribe to RSS Feed
- Permalink
- Report Inappropriate Content
I forgot to reply. This worked perfectly thank you.
- Mark as New
- Bookmark Message
- Subscribe to Message
- Mute Message
- Subscribe to RSS Feed
- Permalink
- Report Inappropriate Content
@Toshbar, glad it worked. Let me convert to answer so that you can accept and mark as answered.
| makeresults | eval message= "Happy Splunking!!!"
CX Day is Coming!
Strengthen Your Future: A Look Back at Splunk 10 Innovations and .conf25 Highlights!
Now Offering the AI Assistant Usage Dashboard in Cloud Monitoring Console
