Turn on suggestions
Auto-suggest helps you quickly narrow down your search results by suggesting possible matches as you type.
Showing results for
All Apps and Add-ons
Turn on suggestions
Auto-suggest helps you quickly narrow down your search results by suggesting possible matches as you type.
Showing results for
- Apps and Add-ons
- :
- All Apps and Add-ons
- :
- Nutanix Prism App on Splunk do not show some valu...
Options
- Subscribe to RSS Feed
- Mark Topic as New
- Mark Topic as Read
- Float this Topic for Current User
- Bookmark Topic
- Subscribe to Topic
- Mute Topic
- Printer Friendly Page
- Mark as New
- Bookmark Message
- Subscribe to Message
- Mute Message
- Subscribe to RSS Feed
- Permalink
- Report Inappropriate Content
Nutanix Prism App on Splunk do not show some value in Dashboard
nichchan
Engager
03-15-2018
02:48 AM
Hi Guy
I want to help from ours
I already configure data input (Nutanix API health, nutanix API cluster , etc) as Clip what explain in " Nutanix App of splunk "
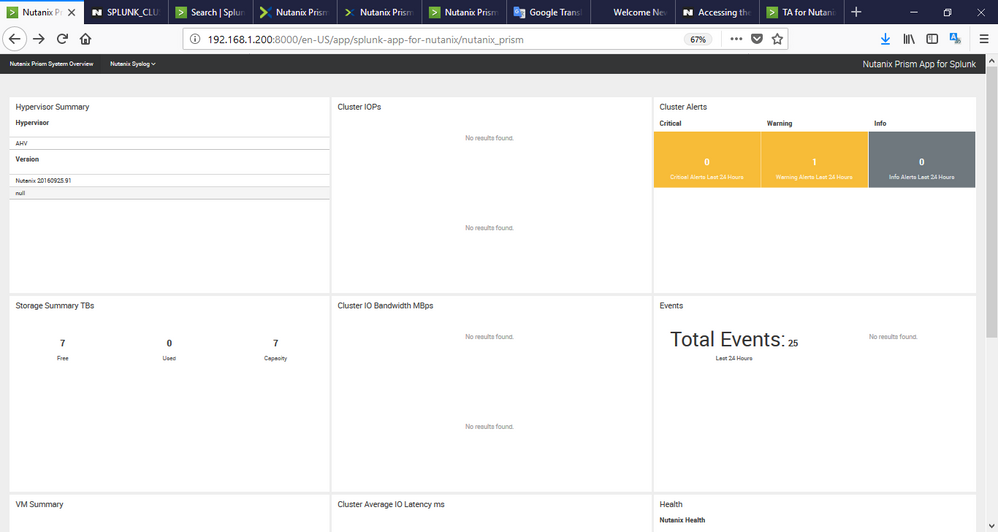
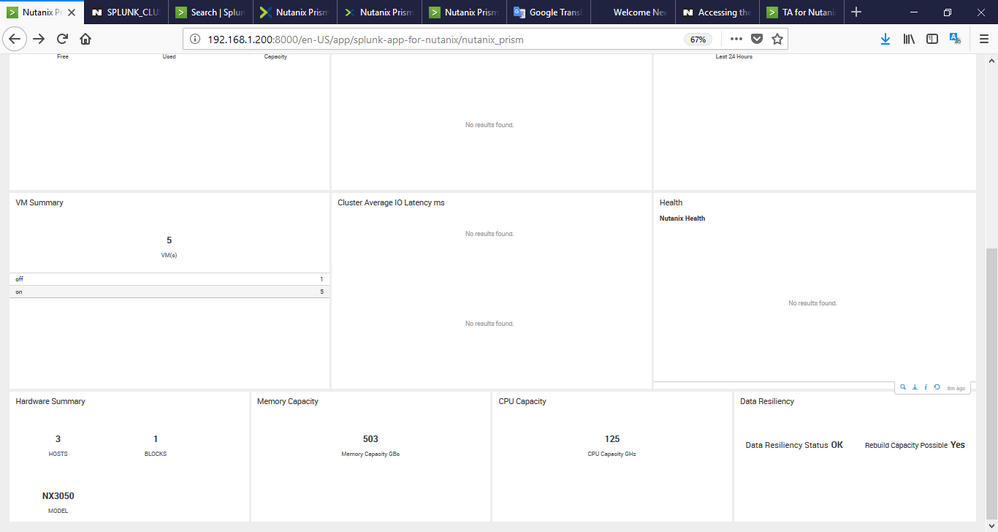
but some value do not show as Cluster IOPs, Cluster IO Bandwidth MBps, Cluster Average IO Latency ms and Nutanix Health.
As I have to attached their picture.
THX
- Mark as New
- Bookmark Message
- Subscribe to Message
- Mute Message
- Subscribe to RSS Feed
- Permalink
- Report Inappropriate Content
cutright_jm
New Member
12-07-2018
10:35 AM
Install the TA on your search head in addition to the indexer; this resolved the issue for me.
- Mark as New
- Bookmark Message
- Subscribe to Message
- Mute Message
- Subscribe to RSS Feed
- Permalink
- Report Inappropriate Content
deepashri_123
Motivator
03-15-2018
03:01 AM
@nichchan,
Open in search and try splitting the query and check if the macros are giving results or is the data getting indexed.That will help getting closer to the exact problem.
Get Updates on the Splunk Community!
Built-in Service Level Objectives Management to Bridge the Gap Between Service & ...
Wednesday, May 29, 2024 | 11AM PST / 2PM ESTRegister now and join us to learn more about how you can ...
Get Your Exclusive Splunk Certified Cybersecurity Defense Engineer at Splunk .conf24 ...
We’re excited to announce a new Splunk certification exam being released at .conf24! If you’re headed to Vegas ...
Share Your Ideas & Meet the Lantern team at .Conf! Plus All of This Month’s New ...
Splunk Lantern is Splunk’s customer success center that provides advice from Splunk experts on valuable data ...


