Are you a member of the Splunk Community?
- Find Answers
- :
- Apps & Add-ons
- :
- All Apps and Add-ons
- :
- Re: Network diagram approach
- Subscribe to RSS Feed
- Mark Topic as New
- Mark Topic as Read
- Float this Topic for Current User
- Bookmark Topic
- Subscribe to Topic
- Mute Topic
- Printer Friendly Page
- Mark as New
- Bookmark Message
- Subscribe to Message
- Mute Message
- Subscribe to RSS Feed
- Permalink
- Report Inappropriate Content
Network diagram approach
I want to present a dashboard to show the flow of a bill (in a shop) from end user to an ERP system .There will be 5 different steps through which the bill flows. I want to show the same as a dashboard where a user will be able to see the status of all steps pictorially represented in a single dashboard which shows status of each step(success/failure) and the status of those servers in each step.
Is there a way to represent the same
- Mark as New
- Bookmark Message
- Subscribe to Message
- Mute Message
- Subscribe to RSS Feed
- Permalink
- Report Inappropriate Content
@dkgs see if following topic on using Status Indicator Custom viz solves your need: https://wiki.splunk.com/User_talk:Niketnilay#Topic_15:_Following_is_an_example_of_Orderflow_Status_T...
Second option could be to use Table as Tile :https://community.splunk.com/t5/Dashboards-Visualizations/Issue-with-css-html-js-Formatting-Search-O...
3rd Option could be Status Matrix Custom Viz on Splunkbase.
| makeresults | eval message= "Happy Splunking!!!"
- Mark as New
- Bookmark Message
- Subscribe to Message
- Mute Message
- Subscribe to RSS Feed
- Permalink
- Report Inappropriate Content
Hello @niketn ,
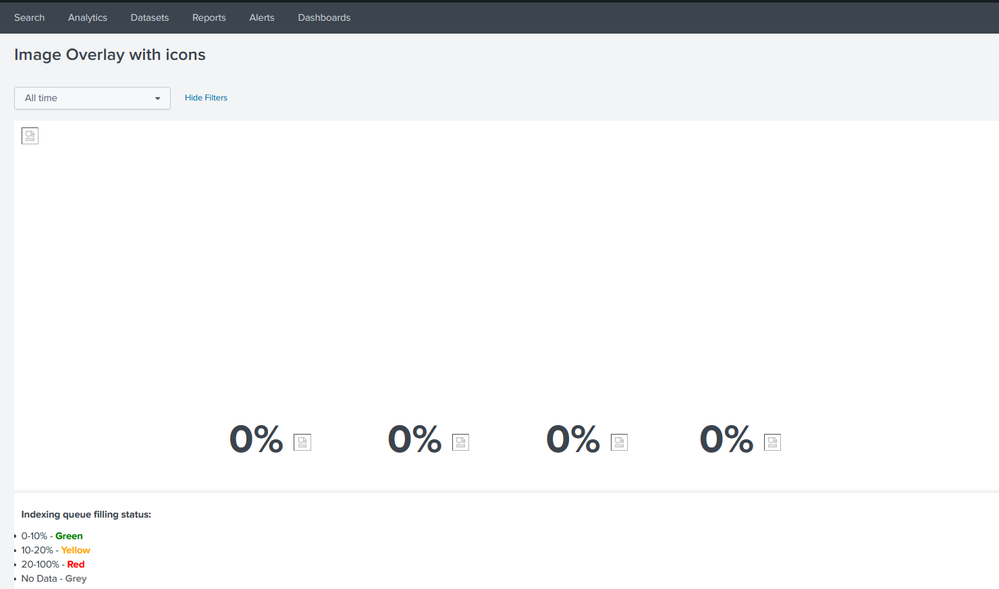
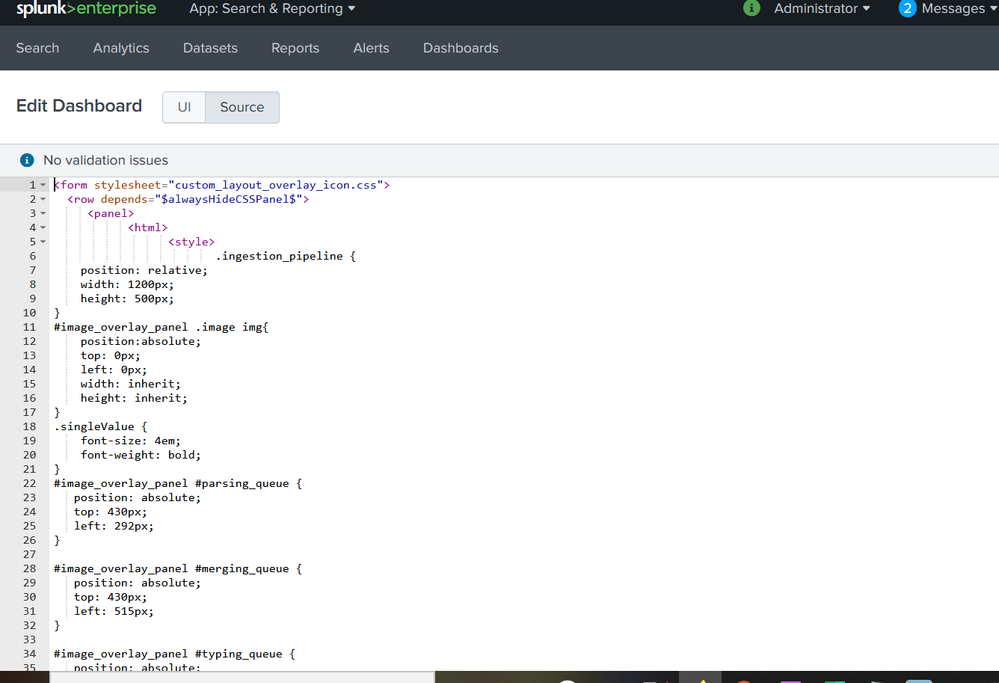
I tried to implement Image Overlay with Icons using the files in Sourcecode.zip given in the below link. I have copied the image_overlay_with_icons.xml and custom_layout_overlay_icon.css accordingly .But i am not seeing the images in the output nor the dashboard , only the html part is visible. Is there anything else i am missing out in this case
Attaching images for your reference
- Mark as New
- Bookmark Message
- Subscribe to Message
- Mute Message
- Subscribe to RSS Feed
- Permalink
- Report Inappropriate Content
@dkgs Topic 15 was on use of Status Indicator Custom visualization that would have added icons using Font Awesome library and would directly work on your Search results which supports Trellis as well.
However, if you think Topic 1 on Image Overlay with icon solves your needs, you need to ensure that you store CSS, background image and icons in the right folder inside your Splunk App. Is your Splunk app BatchDashboard or search because your CSS file was dropped in 1st App folder and Dashboard screenshot is from Search & Reporting (i.e. search) app.
If you want to ensure that your code works (Considering your dashboard is in the Search & Reporting app), please the CSS, Images and Icons in the appserver/static folder of search app (you may have to create the folder if it does not exist). Typically it will be the following folder: $SPLUNK_HOME/etc/apps/search/appserver/static . You can also check out Splunk Dashboard Examples app from Splunkbase for Image overlay example and several other examples with static files. Or refer to Splunk Docs: https://docs.splunk.com/Documentation/Splunk/latest/AdvancedDev/UseCSS
| makeresults | eval message= "Happy Splunking!!!"
- Mark as New
- Bookmark Message
- Subscribe to Message
- Mute Message
- Subscribe to RSS Feed
- Permalink
- Report Inappropriate Content
@niketn Thank you for the detailed response.
Topic 15 , Status Indicator Custom visualization, will it help for showing the server status as well as the status of the Item
And also is Topic 15 and topic 1 are for static values or we can see the status of any number of items.
Thanks in Advance
- Mark as New
- Bookmark Message
- Subscribe to Message
- Mute Message
- Subscribe to RSS Feed
- Permalink
- Report Inappropriate Content
@dkgs
Q1) Topic 15 , Status Indicator Custom visualization, will it help for showing the server status as well as the status of the Item
Niket: Since, if you have to show two KPIs then you can leverage one to be part of Value and other to be part of the label. However, Status Indicator Icon and Color can only be set by the Value.https://community.splunk.com/t5/Archive/Create-Tile-or-Panel-for-each-row-of-table/td-p/453565
An alternate would be to use Table with Multivalue as cell value and then show cell as Tile which would show next to each other. https://community.splunk.com/t5/Dashboards-Visualizations/Is-there-a-way-to-display-more-than-20-cha...
Q2) Topic 15 and topic 1 are for static values or we can see the status of any number of items.
Niket: Topic 15 is dynamic as Status Indicator is a custom viz dependent on SPL results. Even Table option will as mentioned above will be dynamic. Option 1 will be static as it is dependent on token and can only show one row value at a time (for example one order details or one host details at a time).
| makeresults | eval message= "Happy Splunking!!!"
- Mark as New
- Bookmark Message
- Subscribe to Message
- Mute Message
- Subscribe to RSS Feed
- Permalink
- Report Inappropriate Content
Thanks a lot for the help @niketn
- Mark as New
- Bookmark Message
- Subscribe to Message
- Mute Message
- Subscribe to RSS Feed
- Permalink
- Report Inappropriate Content
Anytime @dkgs if any of above options work for you do Accept and up vote 🙂
| makeresults | eval message= "Happy Splunking!!!"


