Are you a member of the Splunk Community?
- Find Answers
- :
- Apps & Add-ons
- :
- All Apps and Add-ons
- :
- How to create network monitoring report for netflo...
- Subscribe to RSS Feed
- Mark Topic as New
- Mark Topic as Read
- Float this Topic for Current User
- Bookmark Topic
- Subscribe to Topic
- Mute Topic
- Printer Friendly Page
- Mark as New
- Bookmark Message
- Subscribe to Message
- Mute Message
- Subscribe to RSS Feed
- Permalink
- Report Inappropriate Content
How to create network monitoring report for netflow and sflow data ?
Hi,
I have ingested netflow and sflow wire data into splunk from our Juniper switches. But there is no visualization app with inbuilt/default dashboards. Basically i am looking for network monitoring report via Splunk similar to Manage Engine/Solarwinds/Ipswitch dashboards.
In the report i wanted to calculate metrics such as bitrate (bps) and traffic volume (bytes transferred in MB/GB).
The search query should calculate these metrics for both netflow and sflow data which has the relevant data in different field names.
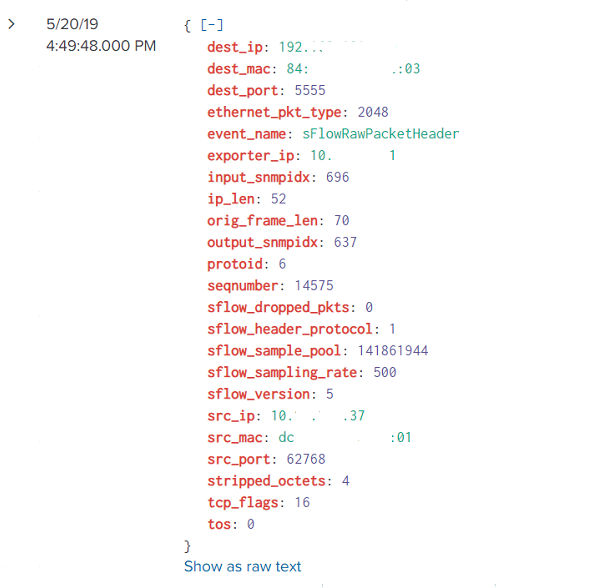
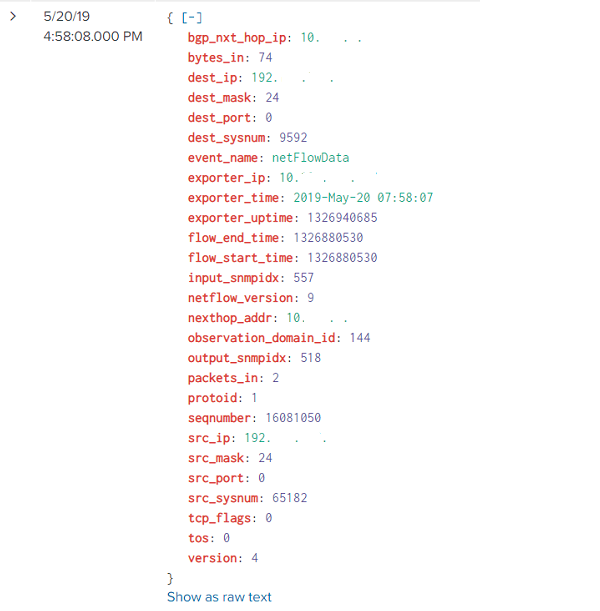
Sample ingested sflow V5 and netflow V9 data fields are attached.
Thanks,
AKG
- Mark as New
- Bookmark Message
- Subscribe to Message
- Mute Message
- Subscribe to RSS Feed
- Permalink
- Report Inappropriate Content
Hi @akg2019,
We can continue the discussion from this link https://answers.splunk.com/answers/663850/using-splunk-stream-for-netflow-now-ingesting-but.html#com... here.
Cheers,
David
- Mark as New
- Bookmark Message
- Subscribe to Message
- Mute Message
- Subscribe to RSS Feed
- Permalink
- Report Inappropriate Content
Hi David,
For sflow: I could not find any Splunk documentation reference. Any thoughts on the below queries related to sflow ?
What are the fields that has to be used for calculating bitrate in sflow?
What is the formula for calculating bitrate from sflow V5 data ?
For Netflow:
What is the formula for calculating bitrate from Netflow V9 data ?
- Mark as New
- Bookmark Message
- Subscribe to Message
- Mute Message
- Subscribe to RSS Feed
- Permalink
- Report Inappropriate Content
I see so many questions about this with no answer haha : https://answers.splunk.com/answers/740793/monitor-bandwidth-with-netflow.html
So lets try to get an answer, have a look at this, it seems like a good explanation for in out :
https://blogs.manageengine.com/network/netflowanalyzer/2009/02/24/in-and-out-reports-with-netflow-an...


