- Apps & Add-ons
- :
- All Apps and Add-ons
- :
- All Apps and Add-ons
- :
- Re: How to change color of area chart?
- Subscribe to RSS Feed
- Mark Topic as New
- Mark Topic as Read
- Float this Topic for Current User
- Bookmark Topic
- Subscribe to Topic
- Mute Topic
- Printer Friendly Page
- Mark as New
- Bookmark Message
- Subscribe to Message
- Mute Message
- Subscribe to RSS Feed
- Permalink
- Report Inappropriate Content
- Mark as New
- Bookmark Message
- Subscribe to Message
- Mute Message
- Subscribe to RSS Feed
- Permalink
- Report Inappropriate Content
Maybe these helps you?
- https://community.splunk.com/t5/Splunk-Search/Change-color-of-pie-chart-based-on-percentage-automati...
- https://community.splunk.com/t5/Splunk-Search/Column-chart-color-change-if-threshold-is-hit/m-p/4326...
- https://community.splunk.com/t5/Splunk-Search/Assign-colour-s-based-on-the-field-value/m-p/331716
Time by time fieldColors didn't work and then you can try that seriesColors (especially when you don't know field names). Also it could be that your field names are not exactly what you are thinking. See the last link above.
r. Ismo
- Mark as New
- Bookmark Message
- Subscribe to Message
- Mute Message
- Subscribe to RSS Feed
- Permalink
- Report Inappropriate Content
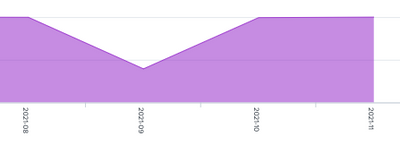
gives this result
It's not clear to me why it's not working in your case
- Mark as New
- Bookmark Message
- Subscribe to Message
- Mute Message
- Subscribe to RSS Feed
- Permalink
- Report Inappropriate Content
Maybe these helps you?
- https://community.splunk.com/t5/Splunk-Search/Change-color-of-pie-chart-based-on-percentage-automati...
- https://community.splunk.com/t5/Splunk-Search/Column-chart-color-change-if-threshold-is-hit/m-p/4326...
- https://community.splunk.com/t5/Splunk-Search/Assign-colour-s-based-on-the-field-value/m-p/331716
Time by time fieldColors didn't work and then you can try that seriesColors (especially when you don't know field names). Also it could be that your field names are not exactly what you are thinking. See the last link above.
r. Ismo
- Mark as New
- Bookmark Message
- Subscribe to Message
- Mute Message
- Subscribe to RSS Feed
- Permalink
- Report Inappropriate Content
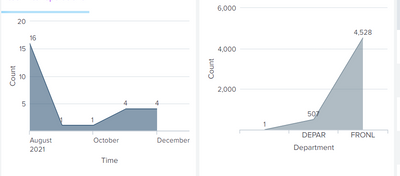
Same code worked on the second graph, but not the first one 🙁
- Mark as New
- Bookmark Message
- Subscribe to Message
- Mute Message
- Subscribe to RSS Feed
- Permalink
- Report Inappropriate Content
- Mark as New
- Bookmark Message
- Subscribe to Message
- Mute Message
- Subscribe to RSS Feed
- Permalink
- Report Inappropriate Content
The graph is for Application Operation Insights, I have mentioned all the 3 fields that is used for the graph to check if any one also is responding to the color code.
<dashboard theme="light" hideChrome="true" hideExport="true">
<label>*Welcome To Lending Command Center*</label>
<description>Lending Command Center is a collection of visualized data which will provide the client with details on its business at various levels of technology and operations.</description>
<row>
<html>
<center><img src="/static/app/search/Header-black@2x-100.jpg" ></img></center>
</html>
</row>
<row>
<panel>
<html>
<b>
<font size="4" color="#BF17FC" face="graphik"> Business Insights</font>
</b>
<br/>
<b>
<font size="2" color="#D28BFC">Insights on business aspects based on location and pricing options used and overview on areas of business expansions and exposures</font>
</b>
</html>
<map>
<search>
<query>source="VLS_OUTSTANDING_GEO.csv" host="dev-bnk-loaniq-" sourcetype="csv" | rename OST_CDE_TRSRY_AREA as "Country" | stats count by "Country" | geom geo_countries featureIdField="Country"</query>
<earliest>0</earliest>
<sampleRatio>1</sampleRatio>
</search>
<!--<title>Insights on business aspects based on location and pricing options used and overview on areas of business expansions and exposures</title>-->
<option name="drilldown">all</option>
<option name="mapping.choroplethLayer.colorBins">5</option>
<option name="mapping.choroplethLayer.colorMode">categorical</option>
<option name="mapping.choroplethLayer.maximumColor">0x5A4575</option>
<option name="mapping.choroplethLayer.minimumColor">0x62b3b2</option>
<option name="mapping.choroplethLayer.neutralPoint">0</option>
<option name="mapping.choroplethLayer.shapeOpacity">0.75</option>
<option name="mapping.choroplethLayer.showBorder">1</option>
<option name="mapping.data.maxClusters">100</option>
<option name="mapping.legend.placement">bottomright</option>
<option name="mapping.map.center">(0,0)</option>
<option name="mapping.map.panning">1</option>
<option name="mapping.map.scrollZoom">0</option>
<option name="mapping.map.zoom">2</option>
<option name="mapping.markerLayer.markerMaxSize">50</option>
<option name="mapping.markerLayer.markerMinSize">10</option>
<option name="mapping.markerLayer.markerOpacity">0.8</option>
<option name="mapping.showTiles">1</option>
<option name="mapping.tileLayer.maxZoom">7</option>
<option name="mapping.tileLayer.minZoom">0</option>
<option name="mapping.tileLayer.tileOpacity">1</option>
<option name="mapping.type">choropleth</option>
<option name="trellis.enabled">0</option>
<option name="trellis.scales.shared">1</option>
<option name="trellis.size">medium</option>
<drilldown>
<link target="_self">/app/loaniq/new_pricing_dashboard</link>
</drilldown>
</map>
</panel>
<panel>
<html>
<b>
<font size="4" color="#BF17FC" face="graphik"> Application Operation Insights</font>
</b>
<br/>
<b>
<font size="2" color="#D28BFC">Insights on the technical aspects of the application for its maintenance and analyze and forecast areas of improvements in the technical operations</font>
</b>
</html>
<chart>
<search>
<query>index=* sourcetype="jackrabbit-3" "userLogInFailed" |timechart count by IPAddress</query>
<earliest>0</earliest>
<latest></latest>
<sampleRatio>1</sampleRatio>
</search>
<option name="charting.fieldColors">{"_time":0x9932CC, "count":0x9932CC, "IPAddress":0x9932CC}</option>
<option name="charting.axisTitleX.text">Time</option>
<option name="charting.axisTitleX.visibility">visible</option>
<option name="charting.axisTitleY.text">Count</option>
<option name="charting.axisTitleY.visibility">visible</option>
<option name="charting.axisTitleY2.visibility">visible</option>
<option name="charting.chart">area</option>
<!--<option name="charting.seriesColors">#D28BFC</option>-->
<option name="charting.chart.showDataLabels">all</option>
<option name="charting.drilldown">all</option>
<option name="charting.legend.placement">none</option>
<option name="refresh.display">progressbar</option>
<option name="trellis.enabled">0</option>
<option name="trellis.scales.shared">1</option>
<option name="trellis.size">medium</option>
<drilldown>
<link target="_self">/app/loaniq/userlogin</link>
</drilldown>
</chart>
</panel>
<panel>
<!--<title>Business Operation Insights</title>-->
<html>
<b>
<font size="4" color="#BF17FC" face="graphik"> Business Operation Insights</font>
</b>
<br/>
<b>
<font size="2" color="#D28BFC">Insights on the timely intervals providing understanding of the business operations and how they are performing</font>
</b>
</html>
<chart>
<search>
<query>| dbxquery query="SELECT CUS_CDE_DEPT, CUS_CDE_EXPENSE, CUS_CDE_BRANCH, CUS_TSP_REC_CREATE, CUS_CDE_CUST_STAT, CUS_CID_CUST_ID, CUS_NME_FULL_NAME, CUS_CDE_COUNTRY FROM \"LoanIQDB\".\"LS2USER\".\"VLS_CUSTOMER\" WHERE CUS_CDE_CUST_STAT IN ('ACT','SKEL') " connection="loaniq_10_10_2_10" |eval CUS_TSP_REC_CREATE_epoc = strptime(CUS_TSP_REC_CREATE,"%Y-%m-%d") | eval CUS_TSP_REC_CREATE = strftime(CUS_TSP_REC_CREATE_epoc,"%Y") | eval Year=strftime(now(),"%Y") |where CUS_TSP_REC_CREATE==Year | stats count by CUS_CDE_DEPT | rename CUS_CDE_DEPT as Department</query>
<earliest>0</earliest>
<latest></latest>
</search>
<option name="charting.fieldColors">{"Department":0x9932CC, "count":0x9932CC}</option>
<option name="charting.axisTitleX.text">Department</option>
<option name="charting.axisTitleX.visibility">visible</option>
<option name="charting.axisTitleY.text">Count</option>
<option name="charting.axisTitleY.visibility">visible</option>
<option name="charting.axisTitleY2.visibility">visible</option>
<option name="charting.chart">area</option>
<option name="charting.chart.showDataLabels">all</option>
<option name="charting.drilldown">all</option>
<option name="charting.legend.placement">none</option>
<option name="refresh.display">progressbar</option>
<drilldown>
<link target="_self">/app/loaniq/onboarded_customers_</link>
</drilldown>
</chart>
</panel>
<panel>
<!--<title>Infrastructure Operation Insights</title>-->
<html>
<b>
<font size="3" color="#BF17FC" face="graphik">Infrastructure Operation Insights</font>
</b>
<br/>
<b>
<font size="2" color="#D28BFC">Insights on business aspects based on location and pricing options used and overview on areas of business expansions and exposures</font>
</b>
</html>
<table>
<search>
<query>index=* sourcetype="WMI:FreeDiskSpace" PercentFreeSpace<100 | search host=* | where NOT IN (Name,"_Total","HarddiskVolume1") | eval FreeSpace=(FreeMegabytes/1024) | table host, Name, PercentFreeSpace | rename host as Host | rename Name as "Drive Name", PercentFreeSpace as "Free Space in %" | sort by Host, "Drive Name" | sort -_time | dedup Host, "Drive Name"</query>
<earliest>0</earliest>
<latest></latest>
<sampleRatio>1</sampleRatio>
</search>
<!--<title>Insights on business aspects based on location and pricing options used and overview on areas of business expansions and exposures</title>-->
<option name="drilldown">cell</option>
<format type="color" field="Free Space in GB">
<colorPalette type="minMidMax" maxColor="#DC4E41" minColor="#FFFFFF"></colorPalette>
<scale type="minMidMax"></scale>
</format>
<format type="color" field="Free Space in %">
<colorPalette type="minMidMax" maxColor="#EAB4FC" minColor="#FFFFFF"></colorPalette>
<scale type="minMidMax"></scale>
</format>
<format type="number" field="Free Space in %">
<option name="precision">0</option>
<option name="unit">%</option>
</format>
<drilldown>
<link target="_self">/app/loaniq/os_metrics</link>
</drilldown>
</table>
</panel>
</row>
</dashboard>- Mark as New
- Bookmark Message
- Subscribe to Message
- Mute Message
- Subscribe to RSS Feed
- Permalink
- Report Inappropriate Content
Your issues is that when you are calculating values like
timechart count by IPAddressthe results are not as count. Actually those are something like count:<IP address> or <IP address>:count. For that reason your fieldColors didn't work as real field names are not what you are expecting and actually you even cannot known those as those are based on real IP address info from your events.
In your case you can get (at least partially) this working when you are using
<option name="charting.seriesColors">[0x9932CC]</option>If you want more colors for different IPAddress then just add those to the end of color part separated with ",".
Unfortunately I don't know if you can change those Count, Time etc. labels (without CSS or other techniques)?
r. Ismo
- Mark as New
- Bookmark Message
- Subscribe to Message
- Mute Message
- Subscribe to RSS Feed
- Permalink
- Report Inappropriate Content
I included the this in source file
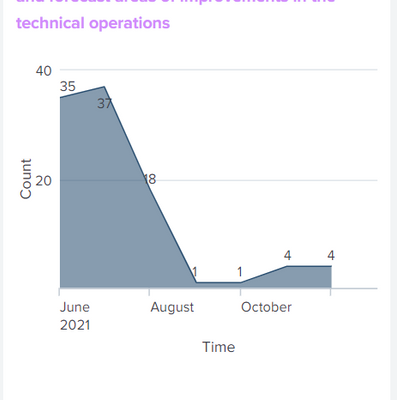
While the page is loading the area is changing colors in the range of blue, the finally setting as grey.
- Mark as New
- Bookmark Message
- Subscribe to Message
- Mute Message
- Subscribe to RSS Feed
- Permalink
- Report Inappropriate Content
<option name="charting.fieldColors">{"yourfieldname":0x9932CC}</option>
- Mark as New
- Bookmark Message
- Subscribe to Message
- Mute Message
- Subscribe to RSS Feed
- Permalink
- Report Inappropriate Content
Not working, still showing same default grey color.


