Are you a member of the Splunk Community?
- Find Answers
- :
- Apps & Add-ons
- :
- All Apps and Add-ons
- :
- Re: How to assign global time for the filter in a ...
- Subscribe to RSS Feed
- Mark Topic as New
- Mark Topic as Read
- Float this Topic for Current User
- Bookmark Topic
- Subscribe to Topic
- Mute Topic
- Printer Friendly Page
- Mark as New
- Bookmark Message
- Subscribe to Message
- Mute Message
- Subscribe to RSS Feed
- Permalink
- Report Inappropriate Content
Hi,
I have a dashboard where I have a time range and a filter for the CI branch.
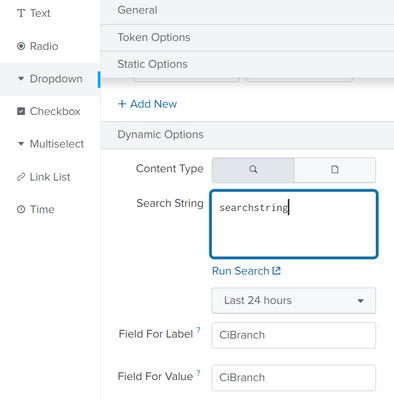
In the time_range what timings I am taking same timings I wanted to apply for CI branch filter also. As of now, it is taking the last 24hr and I don't see any option to assign the time_range for the CiBranch filter.
These are the options under CiBranch
Thanks,
SG
- Mark as New
- Bookmark Message
- Subscribe to Message
- Mute Message
- Subscribe to RSS Feed
- Permalink
- Report Inappropriate Content
Try this.
<form>
	<label>Lighthouse</label>
	<fieldset submitButton="false" autoRun="false">
		<input type="time" token="Lighthouse_Timerange" searchWhenChanged="true">
			<label>time_range</label>
			<default>
				<earliest>-15m</earliest>
				<latest>now</latest>
			</default>
		</input>
		<input type="dropdown" token="CiBranch">
			<label>CiBranch</label>
			<fieldForLabel>CiBranch</fieldForLabel>
			<fieldForValue>CiBranch</fieldForValue>
			<search>
				<query>index=nextgen sourcetype=lighthouse_json datasource=LH | stats count by CiBranch | table CiBranch</query>
				<earliest>$Lighthouse_Timerange.earliest$</earliest>
				<latest>$Lighthouse_Timerange.latest$</latest>
			</search>
		</input>
		</fieldset>
	</form>
KV
- Mark as New
- Bookmark Message
- Subscribe to Message
- Mute Message
- Subscribe to RSS Feed
- Permalink
- Report Inappropriate Content
Try by updating dashboard XML and add earliest and latest manually. Like this.
<earliest>$time_range.earliest$</earliest>
<latest>$time_range.latest$</latest>
Sample Code:
<fieldset submitButton="true">
    <input type="time" token="time_range">
      <label></label>
      <default>
        <earliest>-24h@h</earliest>
        <latest>now</latest>
      </default>
    </input>
    <input type="dropdown" token="field2">
      <label>CIBranch</label>
      <fieldForLabel>log_level</fieldForLabel>
      <fieldForValue>log_level</fieldForValue>
      <search>
        <query>index=_internal log_level=* |stats count by log_level</query>
        <earliest>$time_range.earliest$</earliest>
        <latest>$time_range.latest$</latest>
      </search>
    </input>
  </fieldset>
KV
- Mark as New
- Bookmark Message
- Subscribe to Message
- Mute Message
- Subscribe to RSS Feed
- Permalink
- Report Inappropriate Content
Hi KV,
After updating the XML as suggested my CiBranch dropdown is blocked with a message Could not create search
My dashboard XML after updating the timings
<form>
  <label>Lighthouse</label>
  <fieldset submitButton="false" autoRun="false">
    <input type="time" token="Lighthouse_Timerange" searchWhenChanged="true">
      <label>time_range</label>
      <default>
        <earliest>-15m</earliest>
        <latest>now</latest>
      </default>
    </input>
    <input type="dropdown" token="CiBranch">
      <label>CiBranch</label>
      <fieldForLabel>CiBranch</fieldForLabel>
      <fieldForValue>CiBranch</fieldForValue>
      <search>
        <query>index=nextgen sourcetype=lighthouse_json datasource=LH
| stats count by CiBranch
|  table CiBranch</query>
        <earliest>$time_range.earliest$</earliest>
        <latest>$time_range.latest$</latest>
      </search>
    </input>
- Mark as New
- Bookmark Message
- Subscribe to Message
- Mute Message
- Subscribe to RSS Feed
- Permalink
- Report Inappropriate Content
Try this.
<form>
	<label>Lighthouse</label>
	<fieldset submitButton="false" autoRun="false">
		<input type="time" token="Lighthouse_Timerange" searchWhenChanged="true">
			<label>time_range</label>
			<default>
				<earliest>-15m</earliest>
				<latest>now</latest>
			</default>
		</input>
		<input type="dropdown" token="CiBranch">
			<label>CiBranch</label>
			<fieldForLabel>CiBranch</fieldForLabel>
			<fieldForValue>CiBranch</fieldForValue>
			<search>
				<query>index=nextgen sourcetype=lighthouse_json datasource=LH | stats count by CiBranch | table CiBranch</query>
				<earliest>$Lighthouse_Timerange.earliest$</earliest>
				<latest>$Lighthouse_Timerange.latest$</latest>
			</search>
		</input>
		</fieldset>
	</form>
KV
- Mark as New
- Bookmark Message
- Subscribe to Message
- Mute Message
- Subscribe to RSS Feed
- Permalink
- Report Inappropriate Content
I'm using the global time in a dashboard search as suggested above:
                "queryParameters": {
                    "earliest": "$global_time.earliest$",
                    "latest": "$global_time.latest$"
                }
It works fine if the user selects presets or relative time. But if the user picks a date range, I get an error like this:
Any ideas on how to avoid this date format issue?
- Mark as New
- Bookmark Message
- Subscribe to Message
- Mute Message
- Subscribe to RSS Feed
- Permalink
- Report Inappropriate Content
Hi KV,
This worked perfectly fine. Thanks for the help 🙂


