- Apps & Add-ons
- :
- All Apps and Add-ons
- :
- All Apps and Add-ons
- :
- Re: Donut Chart
- Subscribe to RSS Feed
- Mark Topic as New
- Mark Topic as Read
- Float this Topic for Current User
- Bookmark Topic
- Subscribe to Topic
- Mute Topic
- Printer Friendly Page
- Mark as New
- Bookmark Message
- Subscribe to Message
- Mute Message
- Subscribe to RSS Feed
- Permalink
- Report Inappropriate Content
Donut Chart
Hi
I am trying to convert a PIE Chart which works and displays correctly over to using a Donut Chart but it doesnt display any values.
Has anyone come across this issue and what was the fix
Thanks
Terry
- Mark as New
- Bookmark Message
- Subscribe to Message
- Mute Message
- Subscribe to RSS Feed
- Permalink
- Report Inappropriate Content
index= itam-reporting-database-app-n source=kafka:raw-str-itamr-change-audit*
| eval product_name = PRODUCT_NAME__2_
| search (product_name=SOM-B2B)
| dedup "INFRASTRUCTURE_CHANGE_ID"
| stats dc(INFRASTRUCTURE_CHANGE_ID) as ALL_count by RISK_LEVEL
| eval outcome = (RISK_LEVEL." - ")
| eval outcome = (outcome.ALL_count)
| table outcome ALL_count RISK_LEVEL
- Mark as New
- Bookmark Message
- Subscribe to Message
- Mute Message
- Subscribe to RSS Feed
- Permalink
- Report Inappropriate Content
@TDR57
You should table only outcome and ALL_count.. like
| table outcome ALL_count
BTW which visualisation app you are using for Donut chart?
- Mark as New
- Bookmark Message
- Subscribe to Message
- Mute Message
- Subscribe to RSS Feed
- Permalink
- Report Inappropriate Content
Hi i did try that as well. the donut chart is Donut - Custom Visualization
- Mark as New
- Bookmark Message
- Subscribe to Message
- Mute Message
- Subscribe to RSS Feed
- Permalink
- Report Inappropriate Content
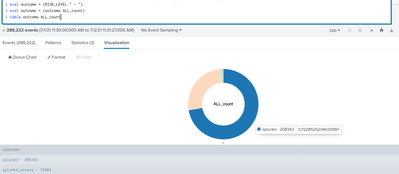
It's working for me. Is this same you are looking for?
This is my search query for replicate same.
index="_internal" sourcetype="splunkd*" | stats count as ALL_count by sourcetype | rename sourcetype as RISK_LEVEL
| eval outcome = (RISK_LEVEL." - ")
| eval outcome = (outcome.ALL_count)
| table outcome ALL_count
You can try this at your local machine as well.
Thanks
KV
▄︻̷̿┻̿═━一
If any of my reply helps you to solve the problem Or gain knowledge, an upvote would be appreciated.
- Mark as New
- Bookmark Message
- Subscribe to Message
- Mute Message
- Subscribe to RSS Feed
- Permalink
- Report Inappropriate Content
This did help but unfortunately it does show the Legend either
- Mark as New
- Bookmark Message
- Subscribe to Message
- Mute Message
- Subscribe to RSS Feed
- Permalink
- Report Inappropriate Content
What is your expectations about the Legend?
- Mark as New
- Bookmark Message
- Subscribe to Message
- Mute Message
- Subscribe to RSS Feed
- Permalink
- Report Inappropriate Content
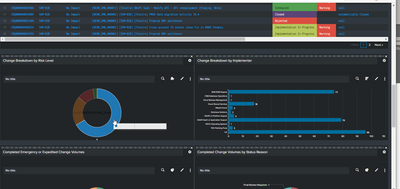
This is what i meant
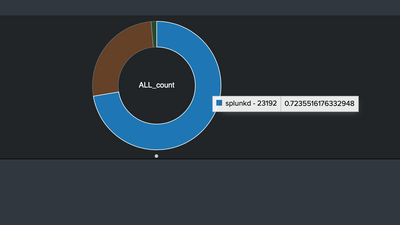
and this is what i get
- Mark as New
- Bookmark Message
- Subscribe to Message
- Mute Message
- Subscribe to RSS Feed
- Permalink
- Report Inappropriate Content
Can you please try this?
<dashboard theme="dark">
  <label>Donut chart</label>
  <row>
    <panel depends="$hideMe$">
      <html>
        <style>
          #donut_chart_1 text.c3-chart-arcs-title {
              fill: white;
          }
          #donut_chart_1 .c3-tooltip-container {
            color: black;
          }
        </style>
      </html>
    </panel>
    <panel id="donut_chart_1">
      <viz type="viz_donut_c3.c3donut">
        <search>
          <query>index="_internal" sourcetype="splunkd*" | stats count as ALL_count by sourcetype | rename sourcetype as RISK_LEVEL
| eval outcome = (RISK_LEVEL." - ")
| eval outcome = (outcome.ALL_count)
| table outcome ALL_count</query>
          <earliest>-60m@m</earliest>
          <latest>now</latest>
          <sampleRatio>1</sampleRatio>
        </search>
        <option name="drilldown">none</option>
        <option name="trellis.enabled">0</option>
        <option name="trellis.scales.shared">1</option>
        <option name="trellis.size">medium</option>
      </viz>
    </panel>
  </row>
</dashboard>
Thanks
KV
▄︻̷̿┻̿═━一
If any of my reply helps you to solve the problem Or gain knowledge, an upvote would be appreciated.
- Mark as New
- Bookmark Message
- Subscribe to Message
- Mute Message
- Subscribe to RSS Feed
- Permalink
- Report Inappropriate Content


