- Find Answers
- :
- Using Splunk
- :
- Other Using Splunk
- :
- Alerting
- :
- Timechart CPU by Process
- Subscribe to RSS Feed
- Mark Topic as New
- Mark Topic as Read
- Float this Topic for Current User
- Bookmark Topic
- Subscribe to Topic
- Mute Topic
- Printer Friendly Page
- Mark as New
- Bookmark Message
- Subscribe to Message
- Mute Message
- Subscribe to RSS Feed
- Permalink
- Report Inappropriate Content
I'm interested in creating an alert scheduled to run every 60 minutes, that will search for hosts which have had > 85% CPU load over a span of 5 minutes. Here's the search:
index=index sourcetype=cpu
| streamstats time_window=5min latest(cpu_load_percent) count by host
| eval cpu_load_percent=if(count<18,null,round(cpu_load_percent, 2))
| where cpu_load_percent>85
| dedup host
| table host, _time, cpu_load_percent
From there, I would like a report generated, wherein for each host a timechart is provided for the last 60 minutes, showing CPU %s for each of the processes run on that host. Ideally this will be a line chart, with a line for each of the top 10 CPU-heavy processes. I've tried using | transaction, and this is what I have so far:
index=index sourcetype=cpu AND sourcetype=top host=$host$
| timechart latest(cpu_load_percent) by COMMAND
I'd really appreciate any guidance on how to implement an alert of this type.
- Mark as New
- Bookmark Message
- Subscribe to Message
- Mute Message
- Subscribe to RSS Feed
- Permalink
- Report Inappropriate Content
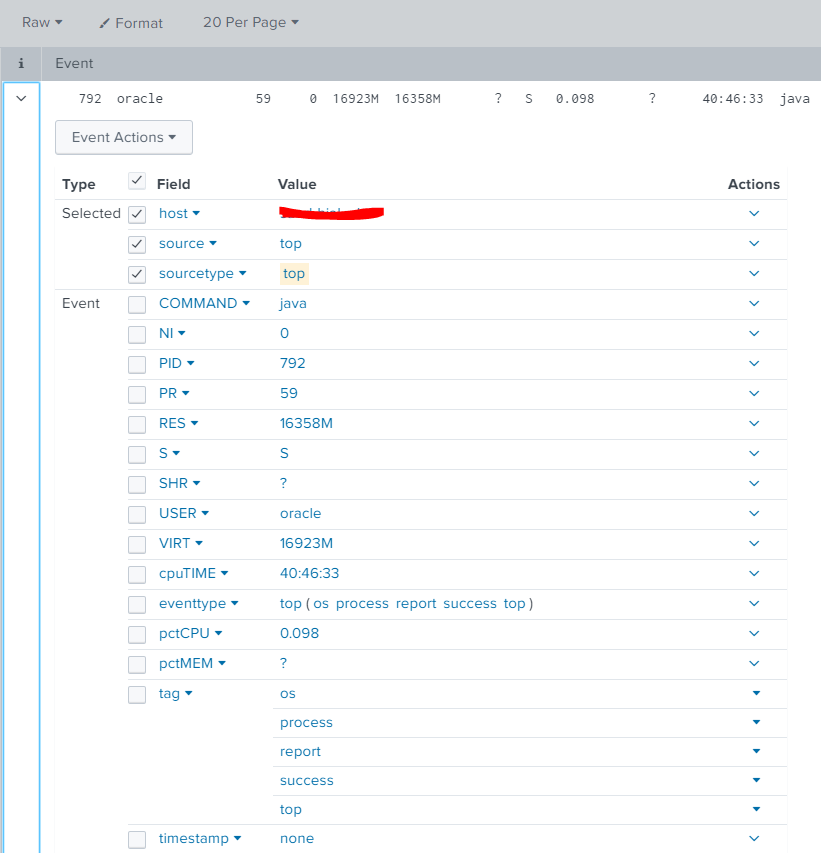
It should be a field alias in recent versions of Splunk_TA_nix. I just verified 8.2.0 and 8.3.0. It's not present in 5.2.4, which is the only other version I have handy.
[top]
...
FIELDALIAS-cpu_load_percent = pctCPU as cpu_load_percent
- Mark as New
- Bookmark Message
- Subscribe to Message
- Mute Message
- Subscribe to RSS Feed
- Permalink
- Report Inappropriate Content
I don't know the result of sourcetype=top at all, so it's hard to say.
- Mark as New
- Bookmark Message
- Subscribe to Message
- Mute Message
- Subscribe to RSS Feed
- Permalink
- Report Inappropriate Content
- Mark as New
- Bookmark Message
- Subscribe to Message
- Mute Message
- Subscribe to RSS Feed
- Permalink
- Report Inappropriate Content
index=index sourcetype=cpu AND sourcetype=top host=$host$
| timechart latest(cpu_load_percent) by COMMAND
sourcetype=top doesn't have cpu_load_percent.
try coalesce
- Mark as New
- Bookmark Message
- Subscribe to Message
- Mute Message
- Subscribe to RSS Feed
- Permalink
- Report Inappropriate Content
It should be a field alias in recent versions of Splunk_TA_nix. I just verified 8.2.0 and 8.3.0. It's not present in 5.2.4, which is the only other version I have handy.
[top]
...
FIELDALIAS-cpu_load_percent = pctCPU as cpu_load_percent

