Join the Conversation
- Find Answers
- :
- Using Splunk
- :
- Other Using Splunk
- :
- Alerting
- :
- Re: Time and Duration Dashboard
- Subscribe to RSS Feed
- Mark Topic as New
- Mark Topic as Read
- Float this Topic for Current User
- Bookmark Topic
- Subscribe to Topic
- Mute Topic
- Printer Friendly Page
- Mark as New
- Bookmark Message
- Subscribe to Message
- Mute Message
- Subscribe to RSS Feed
- Permalink
- Report Inappropriate Content
Time and Duration Dashboard
Hi everyone,
I currently have three dashboards that show the same processes in three states "Ready To Process" , "Processing" and "Complete"
How can I create one other dashboard that shows the duration it takes from "Processing" to "Complete"
- Mark as New
- Bookmark Message
- Subscribe to Message
- Mute Message
- Subscribe to RSS Feed
- Permalink
- Report Inappropriate Content
Can you provide some sample data and the queries you currently have?
- Mark as New
- Bookmark Message
- Subscribe to Message
- Mute Message
- Subscribe to RSS Feed
- Permalink
- Report Inappropriate Content
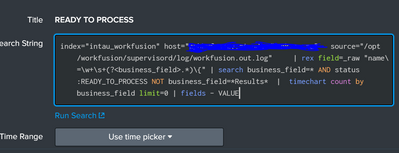
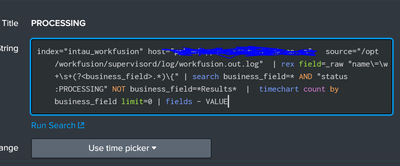
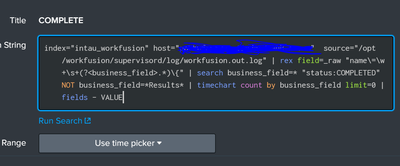
here are the three queries
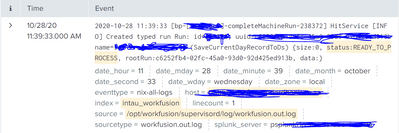
here's a sample data
- Mark as New
- Bookmark Message
- Subscribe to Message
- Mute Message
- Subscribe to RSS Feed
- Permalink
- Report Inappropriate Content
Which part of the data uniquely identifies the process instance id? uuid? name? rootRun? Are any of these already extracted (as interesting fields)?
- Mark as New
- Bookmark Message
- Subscribe to Message
- Mute Message
- Subscribe to RSS Feed
- Permalink
- Report Inappropriate Content
name=process and is extracted as "business_field"
- Mark as New
- Bookmark Message
- Subscribe to Message
- Mute Message
- Subscribe to RSS Feed
- Permalink
- Report Inappropriate Content
yes, business_field is the name of the process
- Mark as New
- Bookmark Message
- Subscribe to Message
- Mute Message
- Subscribe to RSS Feed
- Permalink
- Report Inappropriate Content
So looking at your sample data, business_field would be extracted as "(SaveCurrentDayRecordToDs) ", including the trailing space. This doesn't sound very unique. How do you distinguish one instance of this process running from another instance?
- Mark as New
- Bookmark Message
- Subscribe to Message
- Mute Message
- Subscribe to RSS Feed
- Permalink
- Report Inappropriate Content
for completed in search i add "completed" and for processing i use "processing" in search and so on.. if you look at the queries its business_field + "status" that's what makes it unique
- Mark as New
- Bookmark Message
- Subscribe to Message
- Mute Message
- Subscribe to RSS Feed
- Permalink
- Report Inappropriate Content
If they were unique, your chart would have a single count of 1. What I am trying to get to is how you can detect the start of the process instance running and the end of that instance. For example, if your log looks like this
09:00 (SaveCurrentDayRecordToDs) status:READY_TO_PROCESS
09:01 (SaveCurrentDayRecordToDs) status:PROCESSING
09:02 (SaveCurrentDayRecordToDs) status:COMPLETED
10:00 (SaveCurrentDayRecordToDs) status:READY_TO_PROCESS
10:02 (SaveCurrentDayRecordToDs) status:PROCESSING
10:03 (SaveCurrentDayRecordToDs) status:READY_TO_PROCESS
10:05 (SaveCurrentDayRecordToDs) status:COMPLETED
10:06 (SaveCurrentDayRecordToDs) status:PROCESSING
10:10 (SaveCurrentDayRecordToDs) status:COMPLETED
What would you expect the duration of (SaveCurrentDayRecordToDs) to be? How many durations would you want reported?
How do you distinguish each run of SaveCurrentDayRecordToDs from the other from the data in your logs or do you just assume that COMPLETED applies to the previous READY_TO_PROCESS?
- Mark as New
- Bookmark Message
- Subscribe to Message
- Mute Message
- Subscribe to RSS Feed
- Permalink
- Report Inappropriate Content
Business_field is a value I extracted from the data and it holds different processes within, this is what i used to extract it rex field=_raw "name\=\w+\s+(?<business_field>.*)\{" so different processes will have their own "Ready To Process" or "Completed" and i would be able to see it
- Mark as New
- Bookmark Message
- Subscribe to Message
- Mute Message
- Subscribe to RSS Feed
- Permalink
- Report Inappropriate Content
OK How many SaveCurrentDayRecordToDs READY_TO_PROCESS do you get in your first query?
- Mark as New
- Bookmark Message
- Subscribe to Message
- Mute Message
- Subscribe to RSS Feed
- Permalink
- Report Inappropriate Content
depends on the time range i select
- Mark as New
- Bookmark Message
- Subscribe to Message
- Mute Message
- Subscribe to RSS Feed
- Permalink
- Report Inappropriate Content
Can you give an example?
- Mark as New
- Bookmark Message
- Subscribe to Message
- Mute Message
- Subscribe to RSS Feed
- Permalink
- Report Inappropriate Content
- Mark as New
- Bookmark Message
- Subscribe to Message
- Mute Message
- Subscribe to RSS Feed
- Permalink
- Report Inappropriate Content
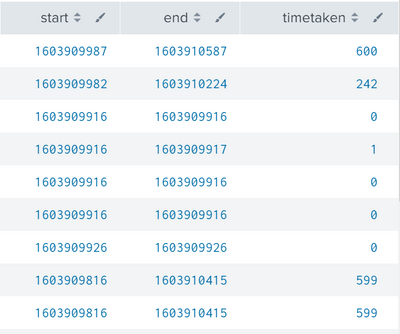
| stats earliest(_time) as start latest(_time) as end by business_field
| eval timetaken=end-start- Mark as New
- Bookmark Message
- Subscribe to Message
- Mute Message
- Subscribe to RSS Feed
- Permalink
- Report Inappropriate Content
Why is the time like this? and where is the start time taken from and the end time?
- Mark as New
- Bookmark Message
- Subscribe to Message
- Mute Message
- Subscribe to RSS Feed
- Permalink
- Report Inappropriate Content
The time taken is in seconds. If you want it as a duration in minutes and seconds, you could try
| fieldformat timetaken=tostring(timetaken,"duration")If you want to see the start and end times you could do this
| fieldformat start=strftime(start,"%Y-%m-%d %H:%M:%S")
| fieldformat end=strftime(end,"%Y-%m-%d %H:%M:%S")
- Mark as New
- Bookmark Message
- Subscribe to Message
- Mute Message
- Subscribe to RSS Feed
- Permalink
- Report Inappropriate Content
To which query do i add it to? "PROCESSING" of "COMPLETE"
