- Find Answers
- :
- Using Splunk
- :
- Other Using Splunk
- :
- Alerting
- :
- Service now Integration,creating tickets with aler...
- Subscribe to RSS Feed
- Mark Topic as New
- Mark Topic as Read
- Float this Topic for Current User
- Bookmark Topic
- Subscribe to Topic
- Mute Topic
- Printer Friendly Page
- Mark as New
- Bookmark Message
- Subscribe to Message
- Mute Message
- Subscribe to RSS Feed
- Permalink
- Report Inappropriate Content
Service now Integration,creating tickets with alerts updating the same ticket everytime when saved search runs.
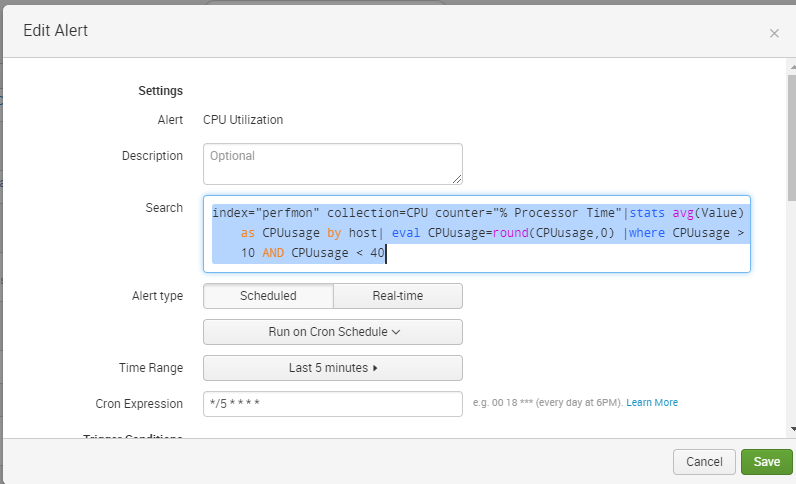
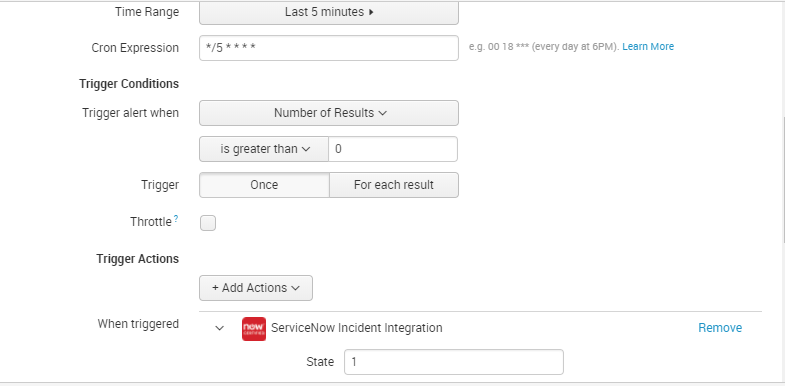
I have created an alert for CPU usage but the ticket is once creating and other alerts are keep on updating in the same ticket.Could anyone please help me on this?
Alert Search as follows:
index="perfmon" collection=CPU counter="% Processor Time"|stats avg(Value) as CPUusage by host| eval CPUusage=round(CPUusage,0) |where CPUusage > 10 AND CPUusage < 40
- Mark as New
- Bookmark Message
- Subscribe to Message
- Mute Message
- Subscribe to RSS Feed
- Permalink
- Report Inappropriate Content
I hope you understood everything by now, I have a doubt. when an alert triggers and create new service now incident with correlation id like "cpuusage:host name", someone works on it and closes it. If alert triggers for the same host again. does it open a closed ticket and update comments or else create a new ticket.
- Mark as New
- Bookmark Message
- Subscribe to Message
- Mute Message
- Subscribe to RSS Feed
- Permalink
- Report Inappropriate Content
Hi @ansif,
what is the servicenow version which you used?
- Mark as New
- Bookmark Message
- Subscribe to Message
- Mute Message
- Subscribe to RSS Feed
- Permalink
- Report Inappropriate Content
Hi Krishnab,
It is Istanbul version.
- Mark as New
- Bookmark Message
- Subscribe to Message
- Mute Message
- Subscribe to RSS Feed
- Permalink
- Report Inappropriate Content
One question,
How are you segregating the high cpu usage??
is it by warning(80&-90%) and critical(>90%).
For creating a new ticket in SNOW,a parameter called sys_id is very important,If correlationid is unique,then sys_id will be unique,then it will create new ticket,else it should just update the existing one,without any notification.
Now assume you have an instance,for warning,when alert is raised and ticket is created in SNOW with sys_id.
Assume sys_id is "A" .
Once you resolve the ticket,then again an alert should be raised with warning state,but it will not raise a new ticket,it just updates the short_description.
So ideally for an instance only 2 ticket will logged for warning and critical state.
Aren't you facing this problem??this is what i'm facing...
- Mark as New
- Bookmark Message
- Subscribe to Message
- Mute Message
- Subscribe to RSS Feed
- Permalink
- Report Inappropriate Content
Hi @ansif,
I found below information on Splunk Service Now Doc. Can you please verify the same?
If you are creating an incident, note that the behavior for the Correlation ID field is slightly different in a custom alert action than it is in the commands and scripts. This variation supports the ability to update incidents using the correlation ID in subsequent custom alert actions. In a custom alert action, if you leave this value blank, the Splunk platform does not generate a random UUID, but generates a correlation ID based on the the md5 of your alert name and the app name. Ensure that you give each alert using a custom alert action a unique name across your Splunk deployment.
http://docs.splunk.com/Documentation/AddOns/released/ServiceNow/Usecustomalertactions
Thanks
- Mark as New
- Bookmark Message
- Subscribe to Message
- Mute Message
- Subscribe to RSS Feed
- Permalink
- Report Inappropriate Content
Thanks Kamlesh.
Can I give something as correlation ID? If so how can I differentiate each alerts correlation ID? Could you please help me with your suggestion.
- Mark as New
- Bookmark Message
- Subscribe to Message
- Mute Message
- Subscribe to RSS Feed
- Permalink
- Report Inappropriate Content
Hi @ansif,
Yes, you can.
"Correlation ID" will help you to manage incident individually. So try to make "Correlation ID" unique and Dynamic. For eg, if you have an alert for CPU Monitoring of multiple hosts then create an alert (in your case) CPU Utilization with "Correlation ID"="CPU Utilization: $result.host$. This will create Incident for a particular host. If 5 host triggering alert then 5 incident will generate.
Please try and let me know for any help.
Happy Splunking
- Mark as New
- Bookmark Message
- Subscribe to Message
- Mute Message
- Subscribe to RSS Feed
- Permalink
- Report Inappropriate Content
Thanks a lot @Kamlesh. This helped me to create new Incidents without duplicate hosts.
Now, can I update the same ticket priority if CPU utilization is above 40?Can I have your assistance please?
And let me know if I close one of the ticket, for same host if alert triggers again it uses the same ticket?Since I am using same correlation id?
I need to open a new ticket if alert triggers again if already raised ticket resolved.
- Mark as New
- Bookmark Message
- Subscribe to Message
- Mute Message
- Subscribe to RSS Feed
- Permalink
- Report Inappropriate Content
Hi @ansif,
Yes, we can update the priority of Incident. I'm not sure SNOW Custom Alert will do that.
I've tried it with SNOW Custom Command. Below is command
This command will use
| snowincident --correlation_id SOME_CORRELATION_ID --priority 1 --category software --short_description "CPU Temrature is very high" --contact_type Phone
You can use streaming command also for same.
| makeresults
| eval correlation_id="SOME_CORRELATION_ID", priority="1", category="software" ,short_description="CPU Temrature is very very high",contact_type=" Phone" | snowincidentstream
http://docs.splunk.com/Documentation/AddOns/released/ServiceNow/Usecustomsearchcommands
In your case, SNOW Custom alert will not help. But you can try to use SNOW Custom Command (snowincidentstream) in Splunk alert to achieve this. Please let me know for any help in this.
Thanks
- Mark as New
- Bookmark Message
- Subscribe to Message
- Mute Message
- Subscribe to RSS Feed
- Permalink
- Report Inappropriate Content
This works like a charm.
Let me know what correlation ID I need to give for n number of hosts?If I give the below:
"Correlation ID"="CPU Utilization: .host."
Does it open closed ticket which is already created using the above correlation ID?
Example :
An alert triggered and it created a ticket,the assignee resolved the ticket.
Now another alert from same host comes,does it open the same ticket?
And may I know how can I schedule this search for every 15 mins and include CPU Utilization of each customer in description
- Mark as New
- Bookmark Message
- Subscribe to Message
- Mute Message
- Subscribe to RSS Feed
- Permalink
- Report Inappropriate Content
"Correlation ID"="CPU Utilization: $result.host$
This Correlation ID will work for you for creating Incident as well as closing the Incident.
Make sure Correlation ID in both alerts will same.
Use --state 7 in SNOW Generating command.
| snowincident --correlation_id SOME_CORRELATION_ID --priority 1 --category software --short_description "CPU Temrature is very high" --contact_type Phone --state 7
Use state=7 in streaming command.
 | makeresults
 | eval correlation_id="SOME_CORRELATION_ID", priority="1", category="software" ,short_description="CPU Temrature is very very high",contact_type=" Phone" | eval state="7"  | snowincidentstream
http://docs.splunk.com/Documentation/AddOns/released/ServiceNow/Usestreamingcommands
Thanks
- Mark as New
- Bookmark Message
- Subscribe to Message
- Mute Message
- Subscribe to RSS Feed
- Permalink
- Report Inappropriate Content
How can I schedule this alert. The above I ran manualy and it worked but how can I include current CPU utilization value. When I include my search it thrown error like snowincident command should use before base search.
PS :- Do we need Event Management plugin in service now to update incidents?
- Mark as New
- Bookmark Message
- Subscribe to Message
- Mute Message
- Subscribe to RSS Feed
- Permalink
- Report Inappropriate Content
Like normal Splunk alert. You have to call SNOW command from alerts.
Your Search Like,
SEARCH_FOR_CLOSING_HOST | eval state="7" | table correlation_id short_description category state | snowincidentstream
Thanks
- Mark as New
- Bookmark Message
- Subscribe to Message
- Mute Message
- Subscribe to RSS Feed
- Permalink
- Report Inappropriate Content
Sorry. I am not getting it.
My scenario is ,need to create an alert when CPU usage is greater than 85%.(Priority 2)
When the same host CPU usage is greater than 90%,I need to update the same ticket with Priority 1.
Which method of ticket creation (Script method,servicenow command or the method I have used in the initial question) I need to use,and may I know the search query and how can I set a polling interval or alert check on every 15 mins?
You have explained me well. Let this question be the complete reference of service now ticket creation.
Please help.
- Mark as New
- Bookmark Message
- Subscribe to Message
- Mute Message
- Subscribe to RSS Feed
- Permalink
- Report Inappropriate Content
@ansif I think what @kamlesh_vaghela meant was if your Splunk search is running fine, you can Save as Splunk alert (maybe three separate alerts with their own priority based on three separate thresholds in your search query).
I also see that a lot of comments in this answer have helped you with various steps for SNOW integration. Please do remember to up vote all the comments that have helped.
| makeresults | eval message= "Happy Splunking!!!"
- Mark as New
- Bookmark Message
- Subscribe to Message
- Mute Message
- Subscribe to RSS Feed
- Permalink
- Report Inappropriate Content
Hi @ansif,
Yes, I'm talking same as @niketnilay mentioned.
1) To create an alert when CPU usage is greater than 85%.(Priority 2) : Use the same method which you have used in the initial question. Don't forget about Correlation ID "Correlation ID"="CPU Utilization: $result.host$
2) host CPU usage is greater than 90%,I need to update the same ticket with Priority 1 : Use snowincidentstream command from my earlier comment and Save as Splunk alert as @niketnilay mentioned.
My Sample Search:
| makeresults
| eval correlation_id="SOME_CORRELATION_ID", priority="1", category="software" ,short_description="CPU Temrature is very very high",contact_type=" Phone" | snowincidentstream
Your like search:
YOUR_SEARCH_FOR_HOST_WITH_90_UP_CPU |
| eval correlation_id="CORRELATION_ID WITH SAME LOGIC OF FIRST ALERT", priority="1", category="software" ,short_description="CPU Temrature is very very high",contact_type=" Phone" | snowincidentstream
Put the same details which you have used for creating Incident.
If you want to close Incident then Use state=7 in streaming command and Save as Splunk alert.
I hope this will help you to make basic lifecycle of SNOW Incident.
Thanks
Happy Splunking
- Mark as New
- Bookmark Message
- Subscribe to Message
- Mute Message
- Subscribe to RSS Feed
- Permalink
- Report Inappropriate Content
Hi @ansif,
Can you please accept the answer to close this question if you have done with this question?
Thanks
Happy Splunking
- Mark as New
- Bookmark Message
- Subscribe to Message
- Mute Message
- Subscribe to RSS Feed
- Permalink
- Report Inappropriate Content


![![alt text][1] ![alt text][1]](/t5/image/serverpage/image-id/3920i6314CDCA79D61D07/image-size/large?v=v2&px=999)
