- Find Answers
- :
- Using Splunk
- :
- Other Using Splunk
- :
- Alerting
- :
- Create an alert email from a splunk search result
- Subscribe to RSS Feed
- Mark Topic as New
- Mark Topic as Read
- Float this Topic for Current User
- Bookmark Topic
- Subscribe to Topic
- Mute Topic
- Printer Friendly Page
- Mark as New
- Bookmark Message
- Subscribe to Message
- Mute Message
- Subscribe to RSS Feed
- Permalink
- Report Inappropriate Content
Hello,
I would like to create an alert based email on the following manually entered search string below. The time frame used was for a 3 minute period, say from 1:02am to 1:05am, 10/2/2020. As one can see from the result only has 3 reasons are present and that is fine as I know more would be reported if there were other reasons to be reported.
index=firewall host=10.10.10.10 | top limit=20 reason
Below is an example of the output:
reason count percentage
Idle Timeout 582 88.7197512
Transport Closing 42 6.402439
DPD Failure 32 4.878049
It is my desire to have this alert be generated any time a reason is equal to or greater than 70% for a 3 minute period. The trigger would be any reason passing that threshold percentage of 70%. I understand this is considered "rolling window triggering" as such the following document was referred to me:
docs.splunk.com/Documentation/SplunkCloud/latest/Alert/DefineRealTimeAlerts#Create_a_real-time_alert_with_rolling_window_triggering
That said, I did not find those instructions to be helpful for a percentage threshold trigger alert. Perhaps what I am hoping to do cannot be done. Nonetheless, I thought I would inquire with the Splunk community.
FYI, we are on code 7.3.5 and have no idea when an upgrade is taking place and to what code version.
Your time, help, patience and feedback is appreciated.
- Mark as New
- Bookmark Message
- Subscribe to Message
- Mute Message
- Subscribe to RSS Feed
- Permalink
- Report Inappropriate Content
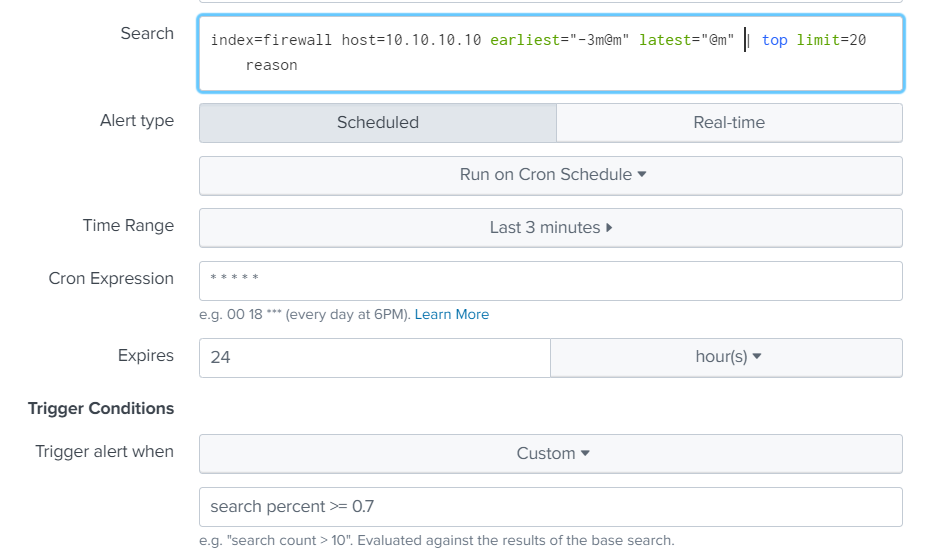
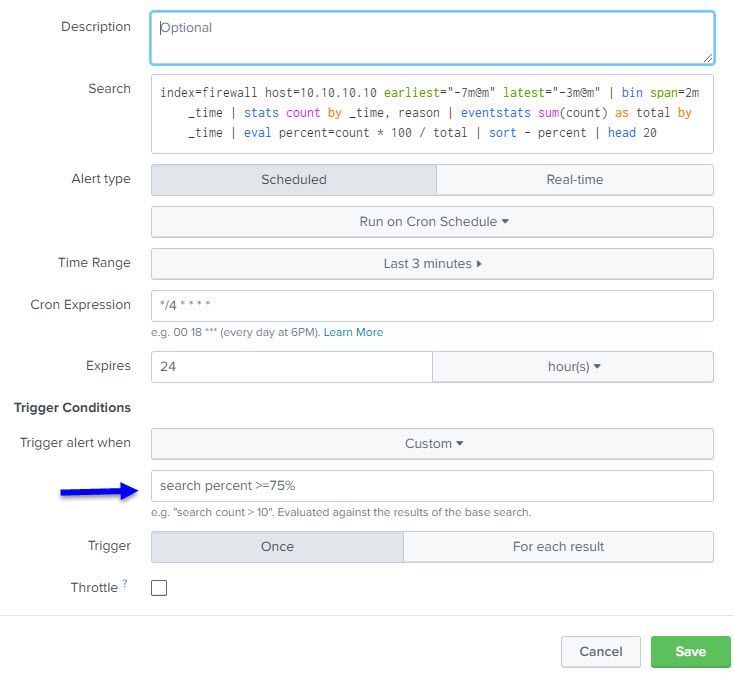
Time range (last 8 minutes) sets the outer limits for the query i.e. earliest 8 minutes ago, latest now. This is then restricted by the actual query (earliest="-7m@m" latest="-3m@m")
cron expression defines when the query is executed for the alert. The first part is the minute of the day, so */4 means every 4th minute. (*/2 would be every other minute, */15 would be every quarter of an hour). The rest of this expression means every hour, every day of the month, every month, every day of the week.
Expires is how long the alert remains on the list of activated alerts before it expires and is removed from the list of alerts. Essentially, you have 24 hours to look at the alert.
Trigger the alert when a custom search returns results, so in this case, when the query has a result with percent >= 75
- Mark as New
- Bookmark Message
- Subscribe to Message
- Mute Message
- Subscribe to RSS Feed
- Permalink
- Report Inappropriate Content
Set your alert to run every minute; depending on how quickly your logs are indexed, set your earliest and latest to cover a 3 minute period relative to when the query is run e.g. earliest="-5m@m" latest="-2m@m"; trigger you alert on percentage >= 70 (might need to be >=0.7 depending on the actual data). Alternative ways to trigger the alert are to put a where clause in to find only reasons where the percentage is >= 70% and then trigger for any result.
- Mark as New
- Bookmark Message
- Subscribe to Message
- Mute Message
- Subscribe to RSS Feed
- Permalink
- Report Inappropriate Content
Hello ITWhisperer,
Thank you much for taking the time to respond, its much appreciated. Sorry ITWhisperer, I did not know how to appropriately incorporate your suggestions.
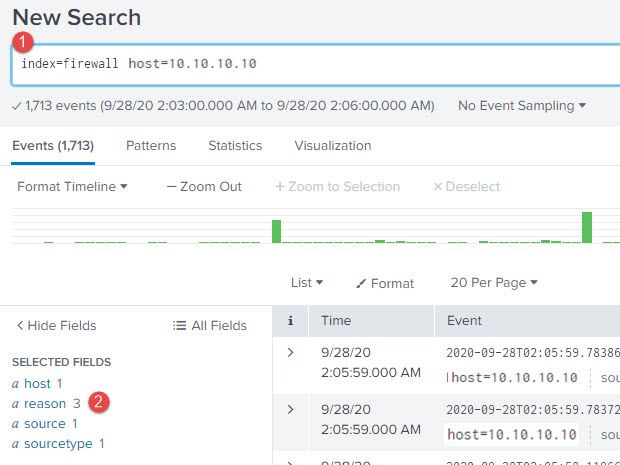
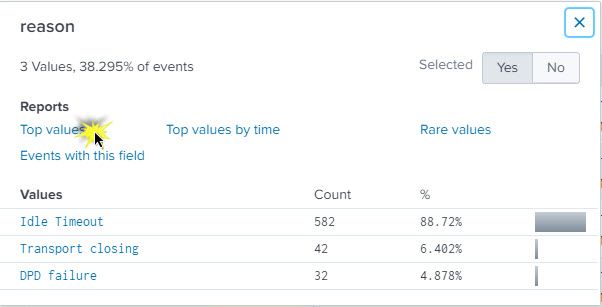
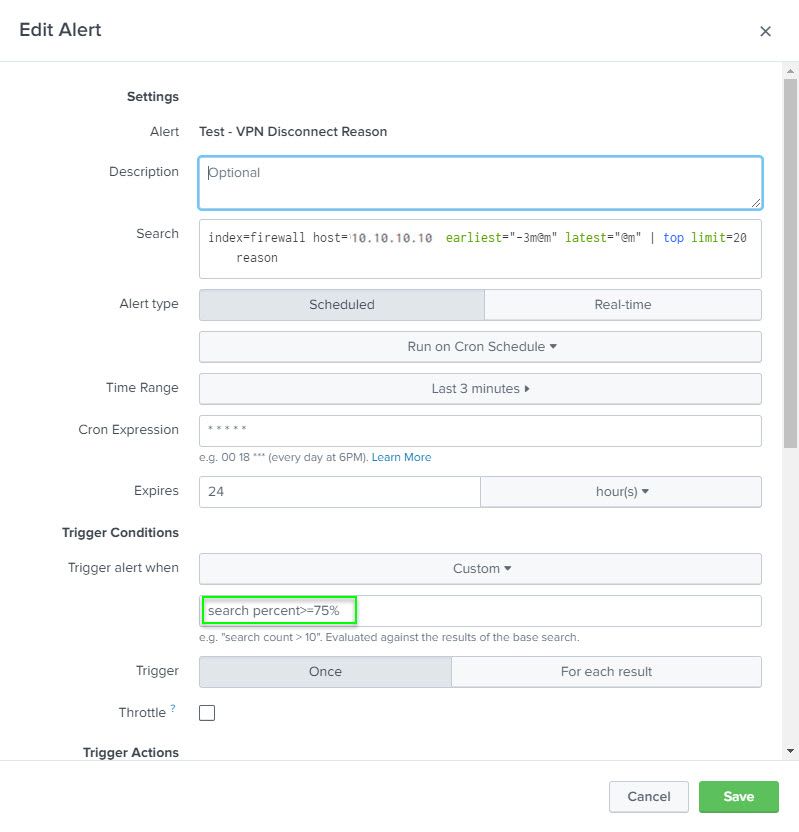
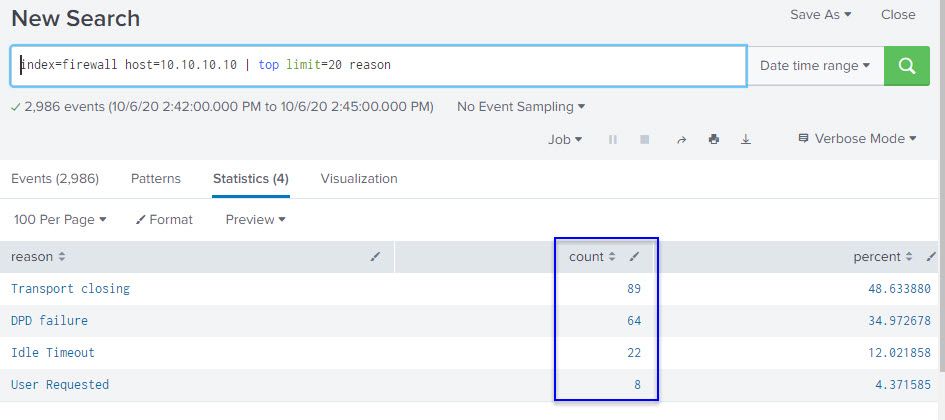
Below is how I got the result mentioned in my original post, please see screenshots. It was a different tool that was used to see (graphically) a precipitous drop in activity. This drop took place during a 1 minute window, so a splunk search was used with a 1min before and after the reported event, hence 3 minutes window.
So I am trying to see if we can receive an email alert with similar info provided in image #3 for any given time for any given reason. I feel like this is doable as I get the result I am looking for by using the steps seen in images 1 thru 3 manually. How can I automate this using a floating 3 minute window?
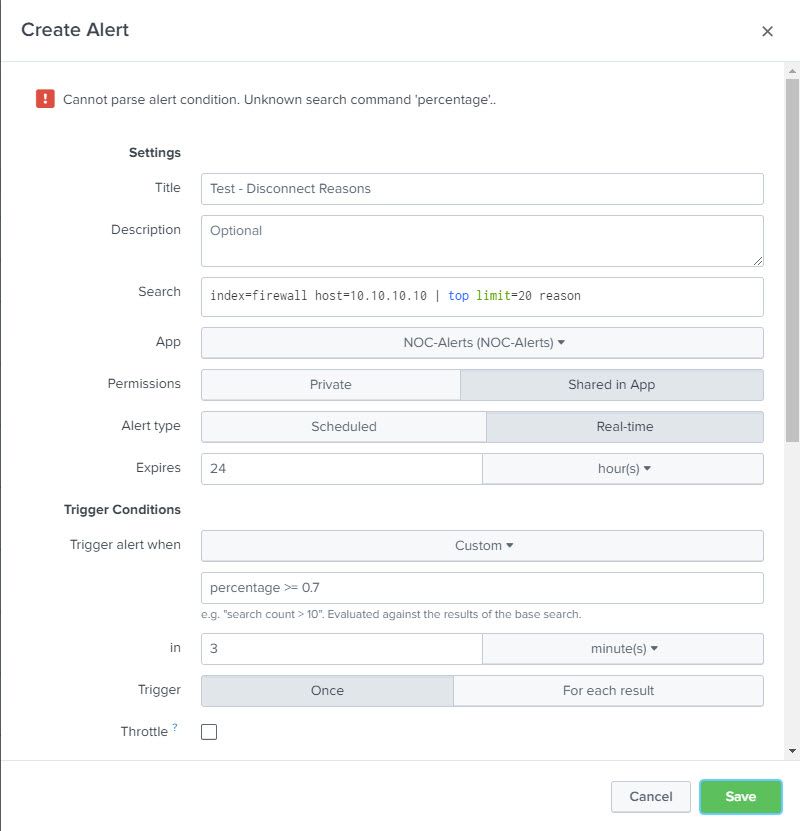
Is it best to do a real time or a schedule (cron job) alert with a delay in running the result as mentioned out of indexing concerns? I am open to suggestions. FYI, image #4 is my feeble attempt to create a "real time alert".
What steps may I follow get the desired results that I get from image #3 for a floating time period where any reason passes a 70% threshold?
Again, thanks for your time, feedback and help.
Below
- Mark as New
- Bookmark Message
- Subscribe to Message
- Mute Message
- Subscribe to RSS Feed
- Permalink
- Report Inappropriate Content
Hi @ToKnowMore
Realtime alerts are expensive, so a scheduled alert might be better. You could run it every minute (still expensive) and look back over the last 3 minutes. Your custom trigger needs to be a search of the results, and your field looks like it is called percent not percentage
Yes, the delay is out of concerns about indexing. If your indexing is fast enough, you can perhaps have a short delay (as above where the latest time is the beginning of the current minute). If you want to give the indexers more chance to have indexed the data then change earliest to say "-5m@m" and latest to "-2m@m" (and change the timerange to last 5 minutes.
- Mark as New
- Bookmark Message
- Subscribe to Message
- Mute Message
- Subscribe to RSS Feed
- Permalink
- Report Inappropriate Content
Hi @ITWhisperer
Hope this message finds you well.
Sorry have had to shuttle from one place to another today. Finally got home.
Thanks very much for your response. I found the provided image to be helpful!
I have implemented your suggestions and Splunk didn't bark at me (I suspect as you anticipated). Will see once the event takes place early tomorrow morning and the desired associated email alert is sent.
Will advise accordingly!
Thanks again for your time, knowledge and patience.
- Mark as New
- Bookmark Message
- Subscribe to Message
- Mute Message
- Subscribe to RSS Feed
- Permalink
- Report Inappropriate Content
Hi @ITWhisperer
Progress! Thanks very much.
I am getting alerts. More than I anticipated. It seems that the email is generated once the total percentage sum is more than 75%.
How may I get the email to generate when the TOP reason is more than 75%?
BTW, I changed from "percent>=.07" as the emails were coming in droves. Once I changed the trigger to "percent>=75%" the emails were less frequent, but I do not see the top reason hitting 75%.
Please see images below.
Your help is appreciated.
Thanks!
- Mark as New
- Bookmark Message
- Subscribe to Message
- Mute Message
- Subscribe to RSS Feed
- Permalink
- Report Inappropriate Content
Hi @ToKnowMore
I am not sure but you could try changing the latest to "-2m@m" so you are only looking at one minute between 3 minutes and 2 minutes ago. This just in case there is more indexing happening which is giving you different results when you look at the data.
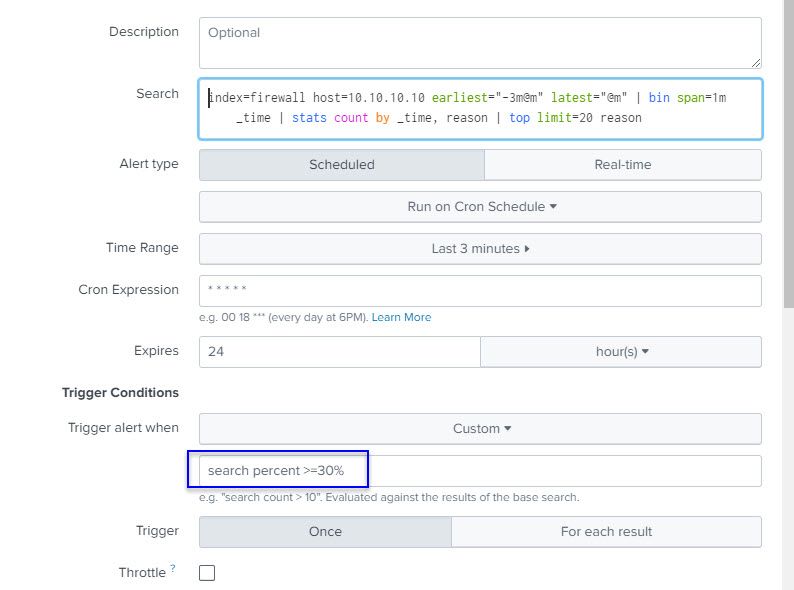
Another option is to break the results up into 1 minute chunks before doing the top so that you find when a reason occurs more than 75% of t
index=firewall host=10.10.10.10 earliest="-3m@m" latest="@m" | bin span=1m _time | stats count by _time, reason | top limit=20 reasonhe time within any minute (which is possibly more what you are after?).
- Mark as New
- Bookmark Message
- Subscribe to Message
- Mute Message
- Subscribe to RSS Feed
- Permalink
- Report Inappropriate Content
Hi @ITWhisperer
Have implemented your suggestion and will advise.
Thanks for your assistance thus far as progress has definitely been made!
Again will advise, so some time may go by before I provide an update.
- Mark as New
- Bookmark Message
- Subscribe to Message
- Mute Message
- Subscribe to RSS Feed
- Permalink
- Report Inappropriate Content
Hi @ITWhisperer
Hope things are well.
Progress report:
I have the trigger percent threshold low (30%), so I may receive the alert to see what results are rendered. As of now, I like what I am seeing as progress is being made, but I think fine tuning is still needed.
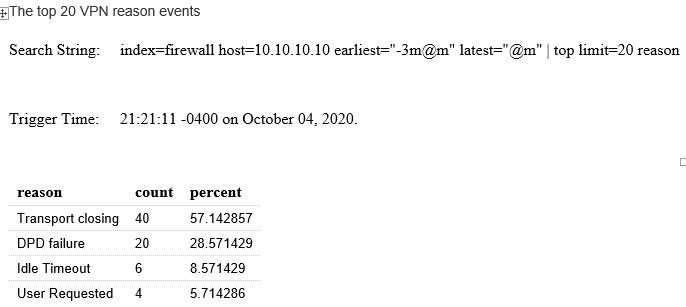
I received an email alert below with the following info, please see image below. I was drawn to the "count" column with the figures being so low for a 3 minute window (if understanding the syntax correctly).
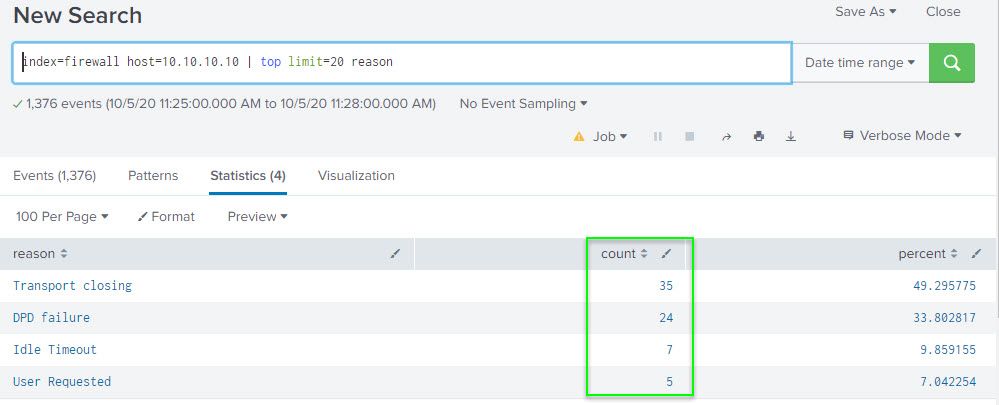
For comparison, I did a manual "top value" check using the time frame of 10/5/2020 11:25am to 11:28am as the email trigger seen from the above image is that of 11:28:09. Please see image below and one can notice the count difference between the two different images:
Is there away to mitigate the difference in the count reporting? If so, how? I would expect the count mount per each reason to be higher during a 3 minute window.
Your time, help and response is appreciated.
- Mark as New
- Bookmark Message
- Subscribe to Message
- Mute Message
- Subscribe to RSS Feed
- Permalink
- Report Inappropriate Content
Hi @ToKnowMore
This does look like there is a delay in the indexing. As I suggested, try changing the latest to "-2m@m" to give the indexers a couple of minutes to get a more substantial count. Or perhaps even earliest "-6m@m" and latest "-3m@m". You probably need to try a few values to see what works best for you.
- Mark as New
- Bookmark Message
- Subscribe to Message
- Mute Message
- Subscribe to RSS Feed
- Permalink
- Report Inappropriate Content
Hi @ITWhisperer
Sorry ITWhisperer, for whatever reason I did not get an email alert that you responded otherwise I would have replied to you immediately.
As of this entry, I have implemented your latest suggestion and will advise results pending some time.
Thanks again for your continued assistance!
- Mark as New
- Bookmark Message
- Subscribe to Message
- Mute Message
- Subscribe to RSS Feed
- Permalink
- Report Inappropriate Content
Hi ITWhisperer,
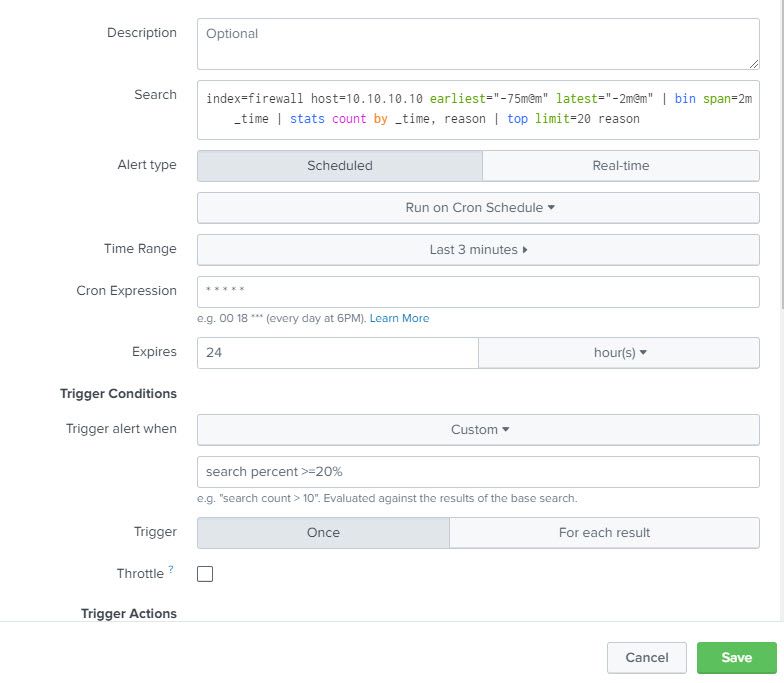
I implemented your suggestions and then made a few adjustments, currently have the following syntax:
index=firewall host=10.10.10.10 earliest="-75m@m" latest="-2m@m" | bin span=2m _time | stats count by _time, reason | top limit=20 reason
Purposely have the trigger threshold set low - 20%
The email generated from the string above is seen below. The count under the count column did increase, but I am bewildered that there is no disparity between the reason codes as seen for count and percentage and/or percentage.
Another example:
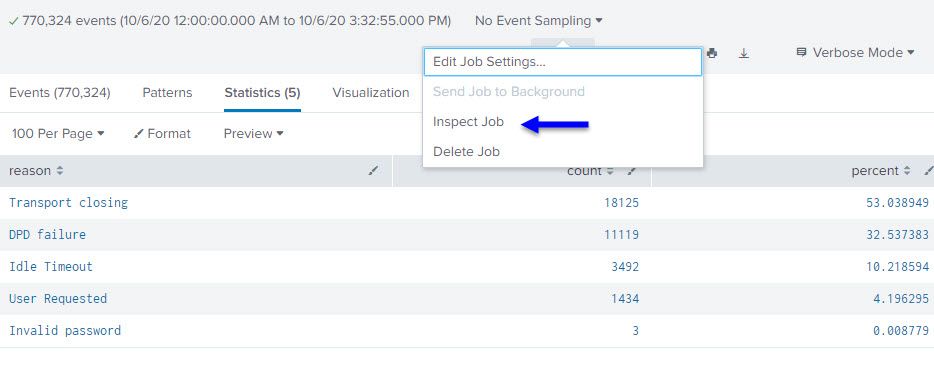
When doing a manual check of top reasons, there is a discernable difference between count/percentage amongst the reason codes.
Is there some additional info that I may provide that could aid in this effort? I saw a job inspector:
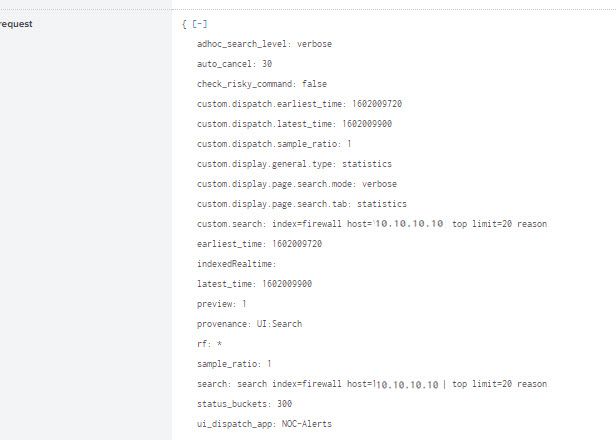
Would it be worthwhile pulling info from the "search job properties" of the manual search seen above and leverage it for what I am trying to do? Below is a screen shot of the "request" portion of the "search job properties"
Thoughts? Is a snickers bar needed?
Your help, time and patience is appreciated!
- Mark as New
- Bookmark Message
- Subscribe to Message
- Mute Message
- Subscribe to RSS Feed
- Permalink
- Report Inappropriate Content
Hi @ToKnowMore
I think I mislead you with my previous suggestion - I looks like top is counting the occurrences of reason in the bins rather than in the original data. Try this instead:
index=firewall host=10.10.10.10 earliest="-76m@m" latest="-2m@m"
| bin span=2m _time
| stats count by _time, reason
| eventstats sum(count) as total by _time
| eval percent=count * 100 / total
| sort - percent
| head 20
I changed the earliest so that earliest - latest is a multiple of the span
- Mark as New
- Bookmark Message
- Subscribe to Message
- Mute Message
- Subscribe to RSS Feed
- Permalink
- Report Inappropriate Content
Hi @ITWhisperer
Thanks for your response.
No worries at all. I've made progress working with you and am appreciative.
I made the adjustment you suggested but tweaked the enlarged number seen below:
index=firewall host=10.10.10.10 earliest="-6m@m" latest="-3m@m" | bin span=2m _time | stats count by _time, reason | eventstats sum(count) as total by _time | eval percent=count * 100 / total | sort - percent | head 20
The reason for the change was the following example email alert below, I found the results going back too far in time:
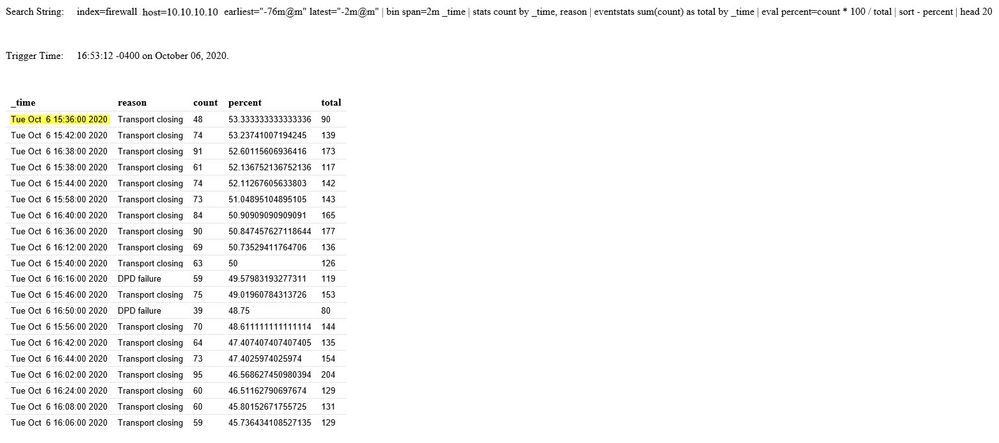
WIth the adjustment mentioned above, I then received an alert with the following result, please note the alert trigger time versus time results reported. I think it looks better.
I upped the trigger percent threshold to 75% so that I do not get frequent emails as I have been with the setting at 20%.
Sorry, from the image directly above, how is the total getting calculated? Also what refinements if any do you recommend?
Also, is it unrealistic of me to do a manual 3 minutes window check at any given time to compare the automated email alert received if and when one gets generated?
Does that make sense?
Thanks for HELP thus far!
- Mark as New
- Bookmark Message
- Subscribe to Message
- Mute Message
- Subscribe to RSS Feed
- Permalink
- Report Inappropriate Content
Setting earliest to -6m@m and latest to -3m@m and span 2m means you will get 2 buckets, one from -6m to -4m and one from -4m to -3m that is one bucket for 2 minutes and another for 1 minute. So you could use -7m@m and -3m@m.
index=firewall host=10.10.10.10 earliest="-7m@m" latest="-3m@m"
| bin span=2m _time
/* Count the number of times each reason occurs in each of the two 2 minute time slots */
| stats count by _time, reason
/* Add all the counts in the same time slot to get the total number of events in each time slot */
| eventstats sum(count) as total by _time
/* Calculate the percentage of total events in each time slot each count represents */
| eval percent=count * 100 / total
/* Find the top reasons by percentage across all time slots */
| sort - percent | head 20
If you want to see what each part does, just add them line by line and look at the results.
- Mark as New
- Bookmark Message
- Subscribe to Message
- Mute Message
- Subscribe to RSS Feed
- Permalink
- Report Inappropriate Content
Update.
Though I increased the trigger threshold to 75%, I am receiving an alert about every minute, similar to the one below:
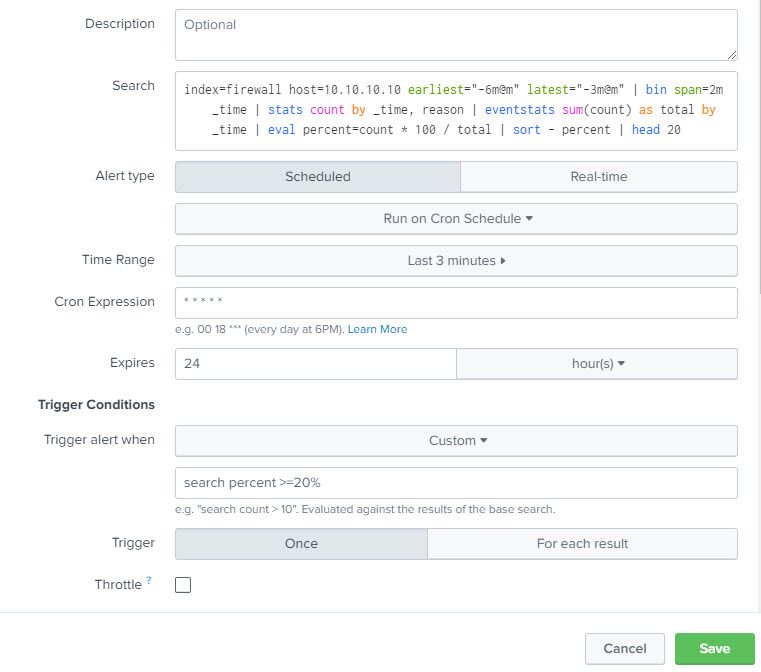
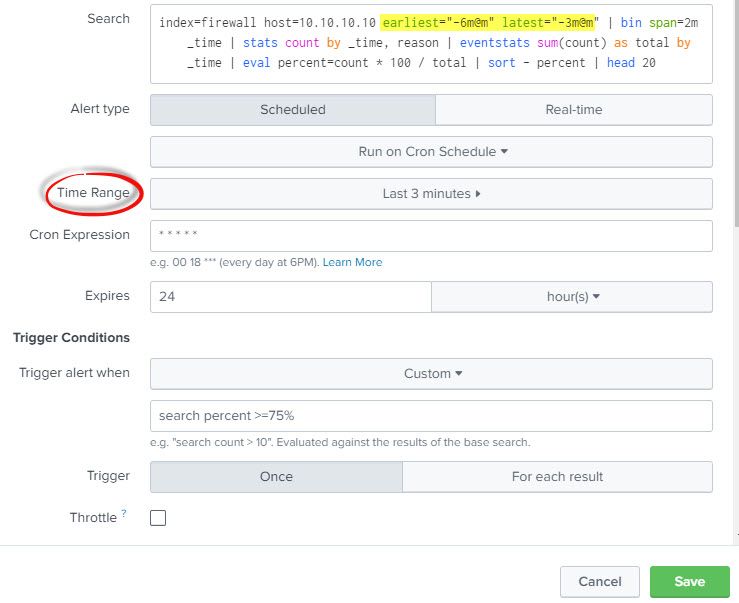
Also, it the time range of 3 minutes seen in the alert configuration somewhat in conflict of what's in the search field?
Sorry for the tremendous amount of questions in the communique and my last post to you.
Thank you.
- Mark as New
- Bookmark Message
- Subscribe to Message
- Mute Message
- Subscribe to RSS Feed
- Permalink
- Report Inappropriate Content
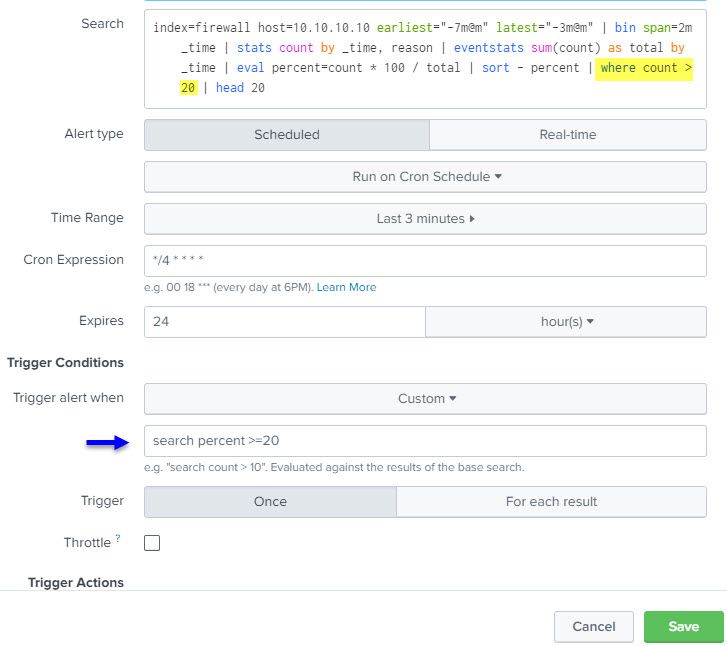
Time range should at least cover the period of the query i.e. at least as far back as the earliest in the query so should be last 7 minutes.
The cron expression is set to run every minute. If you want it to run every 2 minutes, the first * should be */2. Given that the query covers a total of 4 minute (-7 to -3), you could set the first * to */4
- Mark as New
- Bookmark Message
- Subscribe to Message
- Mute Message
- Subscribe to RSS Feed
- Permalink
- Report Inappropriate Content
Hi @ITWhisperer
Thanks for your responses!
Made requested adjustments. I am getting email alerts, however, the highest percent figure is under the trigger threshold of 75%, please see trigger setting (blue arrow).
Should the trigger be percent >= 75 ?
Below is an example of an email alert received with the trigger being percent>=75%
Your time and input is appreciated.
Thanks!
- Mark as New
- Bookmark Message
- Subscribe to Message
- Mute Message
- Subscribe to RSS Feed
- Permalink
- Report Inappropriate Content
Hi @ToKnowMore
Yes, the trigger should be percent >= 75
- Mark as New
- Bookmark Message
- Subscribe to Message
- Mute Message
- Subscribe to RSS Feed
- Permalink
- Report Inappropriate Content
Hi @ITWhisperer
Yuppers, changed the percent trigger as directed.
I received email alerts where the 75 percent threshold was met or surpassed. I was surprised how many I received over night.
To mitigate the early AM email alerts in particular, may I include a "where count > 100"? This would be in addition to the trigger alert of "search percent>=80"?
I ask this because reviewing the emails received in the early AM hours revealed that ANY reason count did not meet or exceed 100.
Is there a way to single out the top reason to have at least a hit count of 100?
I modified the search string with the following to see what results would render in addition to lowering ther percent trigger threshold to 20 to see what email alert values would be generated. At present, I have not received any email alert, so I clearly did not use the "where count > 20" command properly.
index=firewall host=156.33.226.83 earliest="-7m@m" latest="-3m@m" | bin span=2m _time | stats count by _time, reason | eventstats sum(count) as total by _time | eval percent=count * 100 / total | sort - percent | where count > 20 | head 20
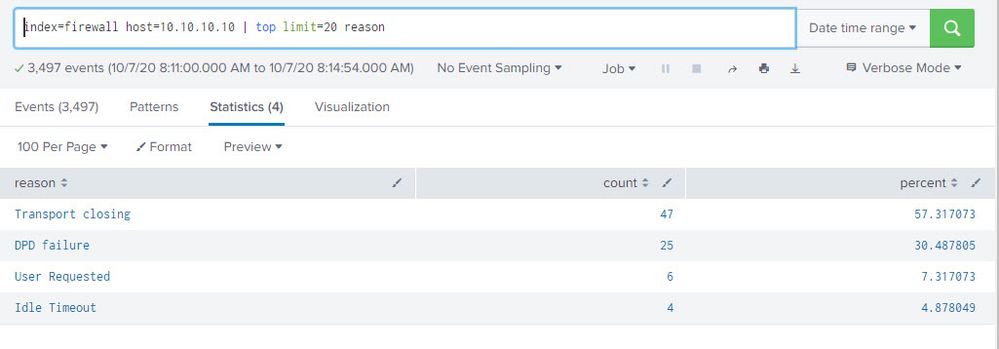
The introduction of "where count > 20" broke the alert, and I say this because no alert has since been generated. I performed a manual 3 minute window check of top reasons, please see below. There are counts above 20 and percent above 20, so was hoping an alert would be generated, but that did not happen.
How can the TOP reason count be taken into consideration in that only take action if that TOP reason account is above 100 (arbitrary number) while maintaining the trigger threshold of 80?
What adjustment is need in the search string?
There is light at the end of the tunnel!
Thanks for your help!!
- Mark as New
- Bookmark Message
- Subscribe to Message
- Mute Message
- Subscribe to RSS Feed
- Permalink
- Report Inappropriate Content
The where count > 20 was correct. However, I did notice that your alert time range is still saying last 3 minutes. try changing this to at least 7 minutes or even last 8 minutes (as I suggested earlier).
