
Join the Conversation
- Find Answers
- :
- Using Splunk
- :
- Splunk Search
- :
- TimeChart round values: How to create search?
- Subscribe to RSS Feed
- Mark Topic as New
- Mark Topic as Read
- Float this Topic for Current User
- Bookmark Topic
- Subscribe to Topic
- Mute Topic
- Printer Friendly Page
- Mark as New
- Bookmark Message
- Subscribe to Message
- Mute Message
- Subscribe to RSS Feed
- Permalink
- Report Inappropriate Content

I need to round the max(Delay) and avg(Delay) to 3 decimals in the following command:
my search | timechart span=5m avg(Delay) max(Delay) by host
Thanks
- Mark as New
- Bookmark Message
- Subscribe to Message
- Mute Message
- Subscribe to RSS Feed
- Permalink
- Report Inappropriate Content


Hi @DPOIRE,
sorry my error!
my search
| bin span=5m _time
| stats avg(Delay) AS avgDelay max(Delay) AS maxDelay by _time host
| eval avgDelay=round(avgDelay,3), maxDelay=round(maxDelay,3)
Ciao.
Giuseppe
- Mark as New
- Bookmark Message
- Subscribe to Message
- Mute Message
- Subscribe to RSS Feed
- Permalink
- Report Inappropriate Content

@DPOIRE You can certainly calculate as many values in timechart as you like and round them as needed, although rounding after a timechart+split_by needs to use "foreach" because the field names are named by the split field (in your case 'host')
| timechart span=5m avg(Delay) max(Delay) by host
| foreach * [ eval "<<FIELD>>"=round('<<FIELD>>', 3) ]
Note that the left hand side of eval uses double quotes and the right hand side, single, round the <<FIELD>>.
That is to take care of any potential odd characters in the host results.
- Mark as New
- Bookmark Message
- Subscribe to Message
- Mute Message
- Subscribe to RSS Feed
- Permalink
- Report Inappropriate Content
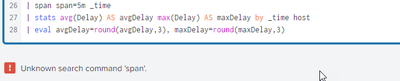
Hi @DPOIRE,
for my knowledge, you cannot calculate two values in timechart, so you need to use stats,
please try this:
my search
| span span=5m _time
| stats avg(Delay) AS avgDelay max(Delay) AS maxDelay by _time host
| eval avgDelay=round(avgDelay,3), maxDelay=round(maxDelay,3)
Ciao.
Giuseppe
- Mark as New
- Bookmark Message
- Subscribe to Message
- Mute Message
- Subscribe to RSS Feed
- Permalink
- Report Inappropriate Content
- Mark as New
- Bookmark Message
- Subscribe to Message
- Mute Message
- Subscribe to RSS Feed
- Permalink
- Report Inappropriate Content
Hi @DPOIRE,
sorry my error!
my search
| bin span=5m _time
| stats avg(Delay) AS avgDelay max(Delay) AS maxDelay by _time host
| eval avgDelay=round(avgDelay,3), maxDelay=round(maxDelay,3)
Ciao.
Giuseppe


Join the Splunk Community Slack to learn, troubleshoot, and make connections with fellow Splunk practitioners in real time!
Join Splunk User Groups to connect and learn in-person by region or remotely by topic or industry.
A Four-Part Event Series: Full Stack Observability For the AI Era
SOC4Kafka - New Kafka Connector Powered by OpenTelemetry
Event Series: Level up your SOC: Advancing with Splunk Enterprise Security
