
Join the Conversation
- Find Answers
- :
- Using Splunk
- :
- Splunk Search
- :
- Splunk - How do i build a timeline chart to trace ...
- Subscribe to RSS Feed
- Mark Topic as New
- Mark Topic as Read
- Float this Topic for Current User
- Bookmark Topic
- Subscribe to Topic
- Mute Topic
- Printer Friendly Page
- Mark as New
- Bookmark Message
- Subscribe to Message
- Mute Message
- Subscribe to RSS Feed
- Permalink
- Report Inappropriate Content
Splunk - How do i build a timeline chart to trace a transaction that has multiple asynchronous processes

I would like to create a timeline view that shows the begin/end time of every event for a given transaction. The transaction is a series of automated/asynchronous processes that run from a single CreateJob request. I want essentially see a bar chart of the events where the x-axis is the "wall clock" and the y-axis is a list of events.
For each event, we have the following data points:
transactionId => links all the different events together
actionName => the name of the event that is being logged
beginTime
endTime
Sample Data:
- timestamp=2018/07/02 12:00:10.572;actionName=ConcludeJob;application=10002;beginTime=2018/07/02 12:00:10.353;endTime=2018/07/02 12:00:10.572;transactionId=123;
- timestamp=2018/07/02 12:00:10.345;actionName=storeFile;application=10002;beginTime=2018/07/02 12:00:10.230;endTime=2018/07/02 12:00:10.345;transactionId=123;
- timestamp=2018/07/02 12:00:10.201;actionName=retrieveItem;application=10002;beginTime=2018/07/02 12:00:10.172;endTime=2018/07/02 12:00:10.201;transactionId=123;
- timestamp=2018/07/02 12:00:05.154;actionName=CreateJob;application=10002;beginTime=2018/07/02 12:00:05.144;endTime=2018/07/02 12:00:05.154;transactionId=123;
What I would like to do is to build a timeline dashboard visualization that has the "wall clock" as the x-axis, each event as a line on the y-axis and then a bar for each event that plots the beginning of the bar as when the event started, the end of the bar as when it ended. This way I could see what all is happening in parallel and which events are the "long pole".
Here is an example of what I am looking for:
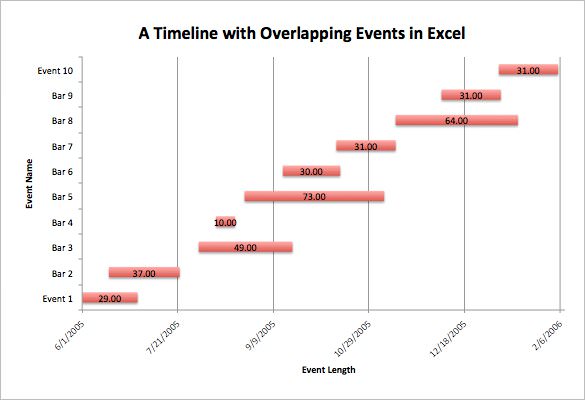
https://images.template.net/wp-content/uploads/2015/07/Timeline-Chart-With-Overlapping-Event-Excel-D...
[unfortunately, I am new, so I may not be able to put the image right in here]
The difference is that in my chart, i would have the following from my sample data:
y-axis:
- CreateJob
- retrieveItem
- storeFile
- ConcludeJob
x-axis:
- Hour:Minute:Second.millisecond
Thanks!
- Mark as New
- Bookmark Message
- Subscribe to Message
- Mute Message
- Subscribe to RSS Feed
- Permalink
- Report Inappropriate Content

@eplate try out the Timeline Custom Visualization
| makeresults | eval message= "Happy Splunking!!!"
- Mark as New
- Bookmark Message
- Subscribe to Message
- Mute Message
- Subscribe to RSS Feed
- Permalink
- Report Inappropriate Content
Thanks - I will see if the admin will install this for me and then try it out. It looks exactly like what I need.

Data Management Digest – December 2025
Index This | What is broken 80% of the time by February?
Unlock Faster Time-to-Value on Edge and Ingest Processor with New SPL2 Pipeline ...
