
Join the Conversation
- Find Answers
- :
- Using Splunk
- :
- Splunk Search
- :
- How do I create a stacked bar chart?
- Subscribe to RSS Feed
- Mark Topic as New
- Mark Topic as Read
- Float this Topic for Current User
- Bookmark Topic
- Subscribe to Topic
- Mute Topic
- Printer Friendly Page
- Mark as New
- Bookmark Message
- Subscribe to Message
- Mute Message
- Subscribe to RSS Feed
- Permalink
- Report Inappropriate Content

I have 3 servers: host=host1, host2, and host3
From these servers I get s_status=ok, nok
I would like to get a graph where I get number of ok from all three servers in one column with servers listed with different colors in the same column.
Eks (Selecting Column as display format)
s_status=ok | timechart count by s_status
This gives me each a column with the sum of all three servers (correct number, but missing the color of each server)
Then I try
s_status=ok | timechart count by host
This gives me the three servers side by side with different colors.
I want them stacked with each server in the same column, but different colors and size depending on the number of ok
Maybe I need to use chart instead of timechart, but I do not know how to put it together.
- Mark as New
- Bookmark Message
- Subscribe to Message
- Mute Message
- Subscribe to RSS Feed
- Permalink
- Report Inappropriate Content
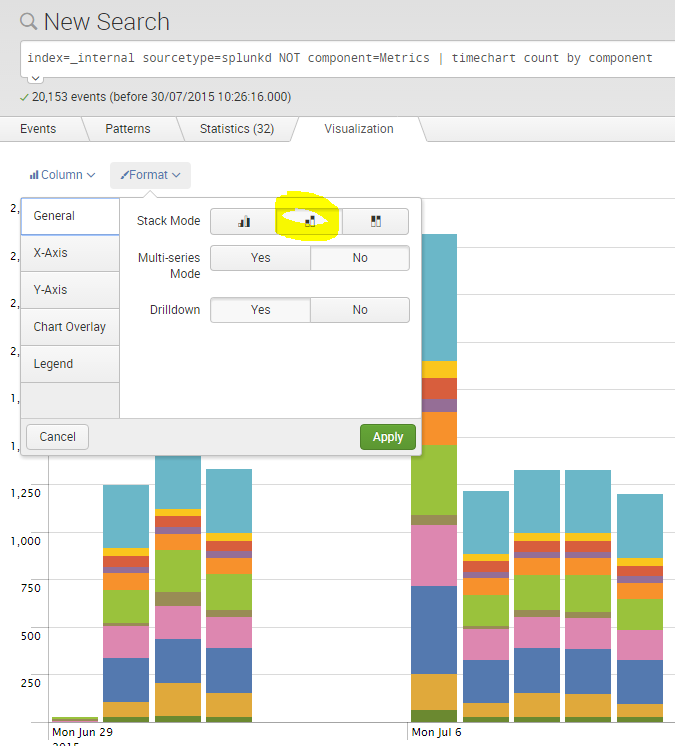
When you're on the visualizations tag (you can see the graph), look for the formatting options, there's an option to stack there.
I'd say you're better to go with your first option though, that way you can have your 'ok's stacked as blue, and your 'nok's stacked as red.... which is more alarming to see than a gap in blue
- Mark as New
- Bookmark Message
- Subscribe to Message
- Mute Message
- Subscribe to RSS Feed
- Permalink
- Report Inappropriate Content
Hi lakromani,
there is a dropdown menu with some format options for your visualization.
If you click Format -> Genereal -> Stack Mode: stacked its might be what you are looking for.
Greetings
- Mark as New
- Bookmark Message
- Subscribe to Message
- Mute Message
- Subscribe to RSS Feed
- Permalink
- Report Inappropriate Content
You are correct, just as pwmcity implied to. Thanks.
- Mark as New
- Bookmark Message
- Subscribe to Message
- Mute Message
- Subscribe to RSS Feed
- Permalink
- Report Inappropriate Content
- Mark as New
- Bookmark Message
- Subscribe to Message
- Mute Message
- Subscribe to RSS Feed
- Permalink
- Report Inappropriate Content
Thanks, just as pwmcity answered, but yours are more visual 🙂
- Mark as New
- Bookmark Message
- Subscribe to Message
- Mute Message
- Subscribe to RSS Feed
- Permalink
- Report Inappropriate Content
When you're on the visualizations tag (you can see the graph), look for the formatting options, there's an option to stack there.
I'd say you're better to go with your first option though, that way you can have your 'ok's stacked as blue, and your 'nok's stacked as red.... which is more alarming to see than a gap in blue
- Mark as New
- Bookmark Message
- Subscribe to Message
- Mute Message
- Subscribe to RSS Feed
- Permalink
- Report Inappropriate Content
Thanks, so simple. I have overclocked the stack mode in Format tab ....



Join the Splunk Community Slack to learn, troubleshoot, and make connections with fellow Splunk practitioners in real time!
Join Splunk User Groups to connect and learn in-person by region or remotely by topic or industry.
A Four-Part Event Series: Full Stack Observability For the AI Era
SOC4Kafka - New Kafka Connector Powered by OpenTelemetry
Event Series: Level up your SOC: Advancing with Splunk Enterprise Security
