Turn on suggestions
Auto-suggest helps you quickly narrow down your search results by suggesting possible matches as you type.
Showing results for
Splunk Dev
Turn on suggestions
Auto-suggest helps you quickly narrow down your search results by suggesting possible matches as you type.
Showing results for
- Splunk Answers
- :
- Using Splunk
- :
- Splunk Dev
- :
- How to pull Meraki Syslog into Splunk in order to ...
Options
- Subscribe to RSS Feed
- Mark Topic as New
- Mark Topic as Read
- Float this Topic for Current User
- Bookmark Topic
- Subscribe to Topic
- Mute Topic
- Printer Friendly Page
- Mark as New
- Bookmark Message
- Subscribe to Message
- Mute Message
- Subscribe to RSS Feed
- Permalink
- Report Inappropriate Content
How to pull Meraki Syslog into Splunk in order to monitor internal port scanning?
cbcadmin
Loves-to-Learn Lots
07-18-2022
02:35 PM
Hey all,
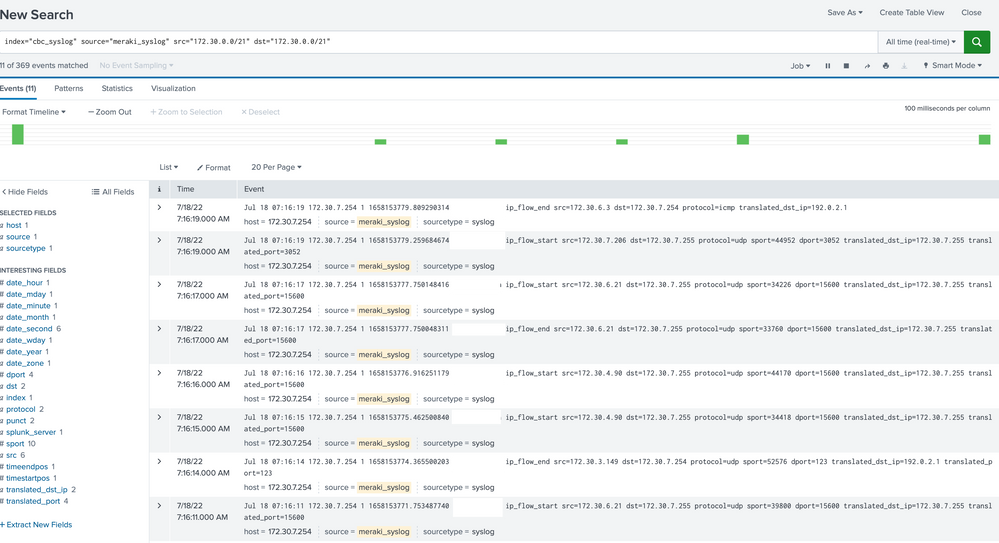
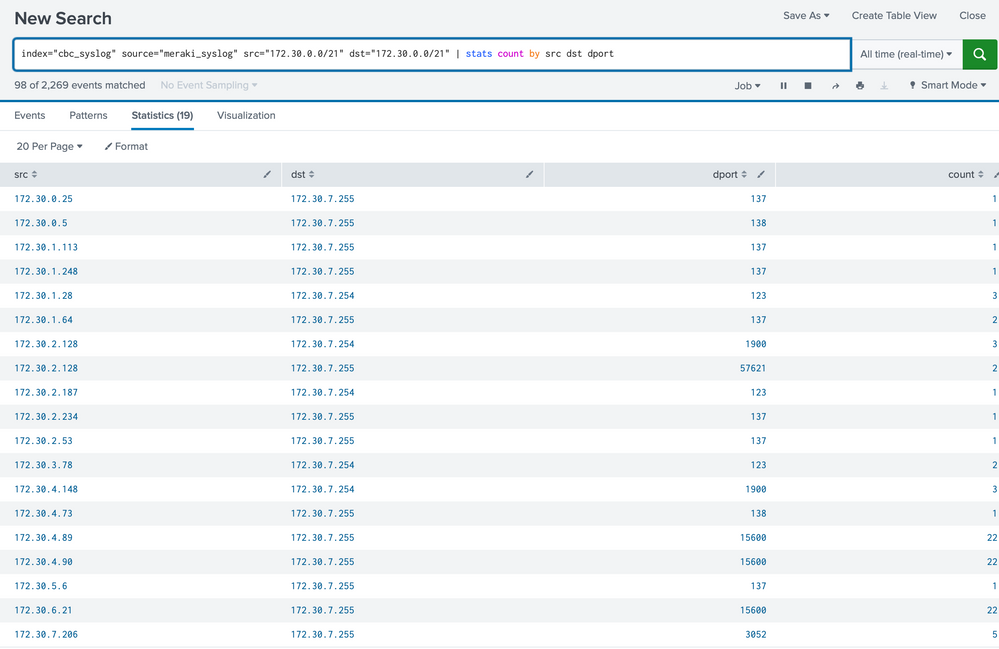
I'm trying to pull in the Syslog or our Meraki MX to our on-premise Splunk Enterprise in order to monitor internal port scanning. Right now I have the Syslogs coming in via the Data input > UDP (514). I see all the data being pulled in correctly however when I search internal traffic communication it shows everything going to the broadcast IP. I'm not sure if I should be using a different method, but I would appreciate some guidance on best practices to monitor internet traffic.
Thanks!
Get Updates on the Splunk Community!
Modern way of developing distributed application using OTel
Recently, I had the opportunity to work on a complex microservice using Spring boot and Quarkus to develop a ...
Enterprise Security Content Update (ESCU) | New Releases
Last month, the Splunk Threat Research Team had 3 releases of new security content via the Enterprise Security ...
Archived Metrics Now Available for APAC and EMEA realms
We’re excited to announce the launch of Archived Metrics in Splunk Infrastructure Monitoring for our customers ...


