- News & Education
- :
- Blog & Announcements
- :
- Product News & Announcements
- :
- Simplify Out-of-the-box Alerting in Three Steps Wi...
Simplify Out-of-the-box Alerting in Three Steps With new AutoDetect!
- Subscribe to RSS Feed
- Mark as New
- Mark as Read
- Bookmark Topic
- Subscribe
- Printer Friendly Page
- Report Inappropriate Content
Alerts are a crucial part of your monitoring and troubleshooting workflow to detect performance anomalies before they can impact your end-user experience. However, it’s often not always clear which metrics matter the most to alert on or what thresholds should be set. As a result, you adopt a manual trial and error approach of experimentation that results in missed critical alerts or receive results with false positives. Meanwhile, this leads to a longer time to resolution and customers leaving. Does this sound familiar to you?
AutoDetect addresses this today with simplified, out-of-the-box alerting for quicker time to value. Available in Splunk Infrastructure Monitoring at no additional charge, start detecting problems with your critical infrastructure components and services in minutes. Remove the pain and complexity of manually setting up your IT environment to automatically discover anomalies in your infrastructure in seconds. Here’s how!.
Step 1: Instrument your telemetry data for quick time to value
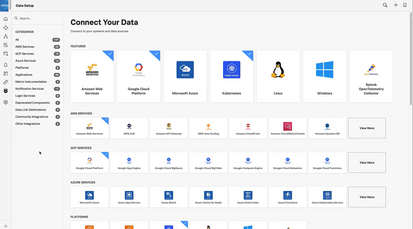
Use preconfigured AutoDetect detectors on the metrics and metadata that you are sending to Splunk Infrastructure Monitoring today. Detectors for common infrastructure components and services based on the expertise and experience of our technology partners and customers. Draw on a comprehensive list of supported integrations to connect and send your data using OpenTelemetry standards and avoid vendor lock-in.
Step 2: Start monitoring your infrastructure state in minutes
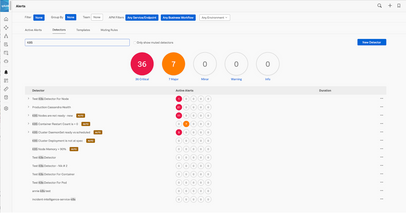
View a complete list of all your AutoDetect alerts and detectors directly from the Alerts page in Splunk Observability Cloud. Look up the Active Alerts or Detectors tab for alerts and detectors that have been assigned an AUTO badge. These will show up for the relevant integrations you have installed earlier - AutoDetect alerts and detectors that support integrations like AWS, Kubernetes, Kafka just to name a few.
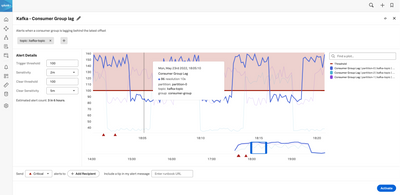
Subscribe to your choice of AutoDetect alerts and detectors and manage notification subscribers that are sent to the right people, channels, and systems in your organization. Like any alerts and detectors in Splunk Observability Cloud, you can mute notifications using rules or choose later to delete these notifications with one click. Simply enter the name of the alert or detector in the search field that auto-completes as you type and disable it. Customize AutoDetect detectors and alerts to filter notifications by infrastructure or service. Adjust thresholds and conditions for more accurate alerting and notify by alert severity to reduce noise.
(Pro-tip: Clone and reuse AutoDetect alerts and detectors to create your own as you get familiar with Splunk Observability Cloud. Set your own alert thresholds and conditions for actionable alerts that are customized to your environment to reduce alert noise and eliminate false positives by testing against historical data.)
Step 3: Detect and Alert on infrastructure anomalies in seconds
Powered by Splunk Observability Cloud’s real-time streaming architecture that uses a NoSampling™ full fidelity ingest for all your telemetry data, never miss anomalies and ensure that you receive instant notifications for your AutoDetect alerts and detectors.
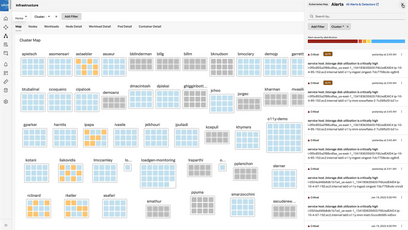
Proceed to the Infrastructure page in Splunk Observability Cloud for rich, context-based visualizations. Select the relevant integrations installed to view Infrastructure Navigators that are automatically created within Splunk Observability Cloud. From a single, consolidated dashboard enjoy an immediate, comprehensive understanding of your infrastructure state.
AutoDetect automatically covers anomaly detection of common infrastructure components for critical patterns and sends notifications on throttling once system limits are being hit. Hover over squares in the heat map shown in the navigator and drill down for more information about that instance through built-in dashboards and charts.
Use Splunk Observability Cloud’s real-time streaming architecture for analytics power insights to identify and isolate problems faster with no dead-end investigations. Select Alerts or Active Detectors in the Filter bar to surface a sidebar for AutoDetect alerts and detectors indicated by the AUTO badge. View events generated from alerts and detectors before seamlessly jumping between components in Splunk Observability Cloud and click on related content for directed troubleshooting and root cause analysis.
(Pro-tip: With deep-linking to logs in Splunk Cloud Platform from Observability Cloud, you can troubleshoot the issue and identify a root cause across your on-premises and cloud environment. Explore for patterns and trends across your IT environment with powerful analytics and correlation at your fingertips.)
Learn more today
Whether on-premises, hybrid or multi-cloud, deliver real-time infrastructure monitoring and troubleshooting for all environments. Experience AutoDetect in action from Splunk Infrastructure Monitoring and start building for speed, scale, and analytics in your modern monitoring.
Sign up for a free trial today to see first hand why.
— Collin Chau, Sr. Product Marketing Manager - Splunk Observability Solutions
You must be a registered user to add a comment. If you've already registered, sign in. Otherwise, register and sign in.
Join Us for Splunk University and Get Your Bootcamp Game On!
.conf24 | Learning Tracks for Security, Observability, Platform, and Developers!
Announcing Scheduled Export GA for Dashboard Studio
-
Customer Experience
9 -
Data Stream Processor
1 -
Edge Processor
2 -
OpenTelemetry
1 -
other
7 -
Product Announcements
1 -
Splunk APM
20 -
Splunk Cloud Platform
62 -
Splunk Community
1 -
Splunk Enterprise
45 -
Splunk Enterprise Security
43 -
Splunk Infras Monitoring
17 -
Splunk ITSI
11 -
Splunk Lantern
1 -
Splunk Mission Control
4 -
Splunk Observability Cloud
78 -
Splunk On-Call
2 -
Splunk Security Cloud
21 -
Splunk SOAR
15 -
Splunk UBA
2 -
Splunkbase Apps & Add-Ons
16 -
User Groups
1
- « Previous
- Next »


