- News & Education
- :
- Blog & Announcements
- :
- Product News & Announcements
- :
- NEW! Log Views in Splunk Observability Dashboards ...
NEW! Log Views in Splunk Observability Dashboards Gives Context From a Single Page
- Subscribe to RSS Feed
- Mark as New
- Mark as Read
- Bookmark Topic
- Subscribe
- Printer Friendly Page
- Report Inappropriate Content
Today, Splunk Observability releases log views, a new feature for users to add their logs data from Splunk Log Observer and Log Observer Connect directly to their Observability dashboards - all while drawing on existing Splunk instances from a familiar, extensible data platform. Log views combine the easy UI of Log Observer with the flexibility and power of Splunk Observability dashboards. This allows users to complete the troubleshooting journey in one place: metrics-based alerts and trends show what changed and when the problem started, and log views provide full detail of what’s happening and why.
Log views show logs from any data source that you can see in Log Observer, including logs from the Splunk platform through Log Observer Connect. Automatically stream an updated feed of all your log messages on a Splunk Observability custom dashboard, just as you would see in Log Observer. From the dashboard, click on a log message to show complete details of what happened and connect to related traces from log messages to understand why - just as you would when exploring data in Log Observer. Here’s how you can get started in just 3 steps:
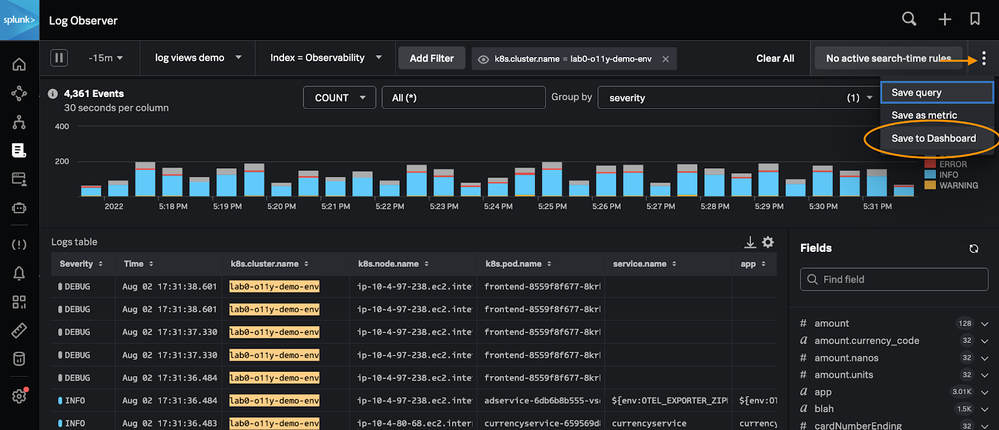
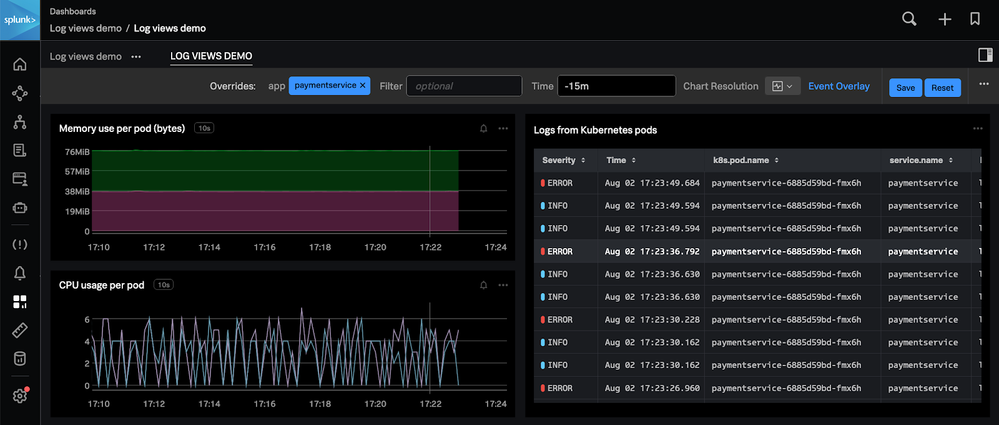
Step #1: Adding log views to dashboards begins in Splunk Log Observer. Customize the logs you want to see using Log Observer’s time picker, filter controls, and column configuration. When ready choose ‘Save to Dashboard’ to add logs views to the dashboard of your choosing. Next, open the designated dashboard to automatically see the exact same log messages you had in Log Observer, but now side-by-side with real-time streaming metrics for trends and contextual insights when troubleshooting from Splunk Observability.
Step #2: With log views, your Splunk Observability dashboards deliver a unified UI for exploring all of your logs and metrics data in one place. Working with logs and metrics together from within the same dashboard using exactly the same controls (like filters and time), makes it easier and faster to solve problems. Isolate where a problem is occurring with metrics-based trends to understand why it is happening with useful details from pertinent logs.
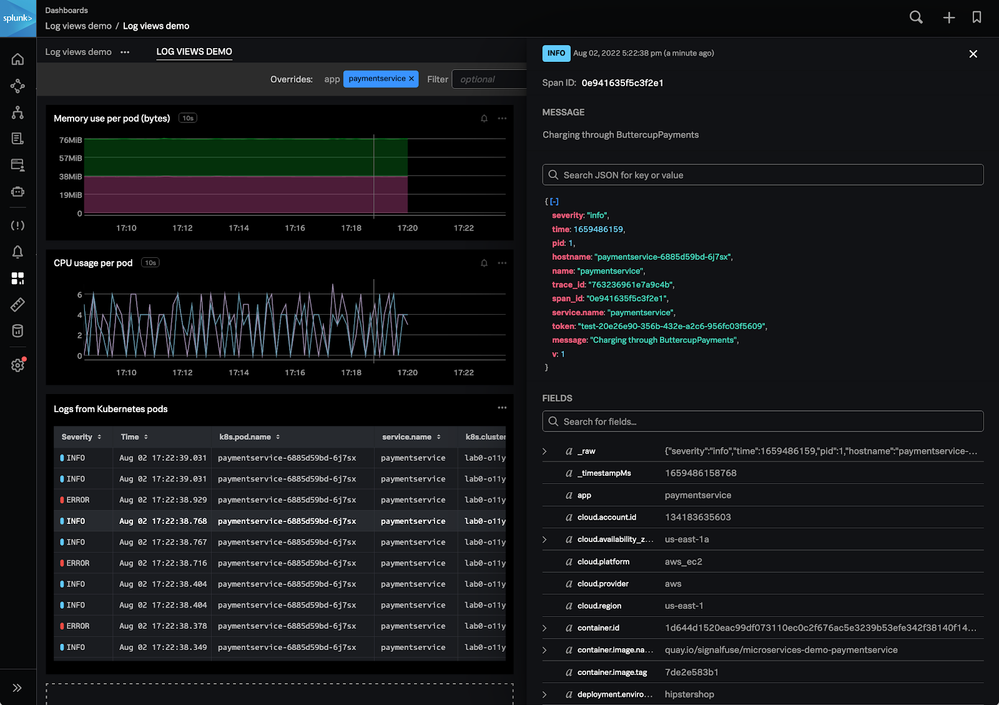
Change the time window on the dashboard to show log messages and metrics trends from the selected time. As you slice-and-dice to filter the dashboard to see which systems are affected, log views respond to that filter exactly as metrics charts do. In log views, show suspicious log messages filtered by keywords to describe important events that have happened for a service or application. Click and open interesting log messages to see full details of what happened, and what to do about it - right from the same dashboard.
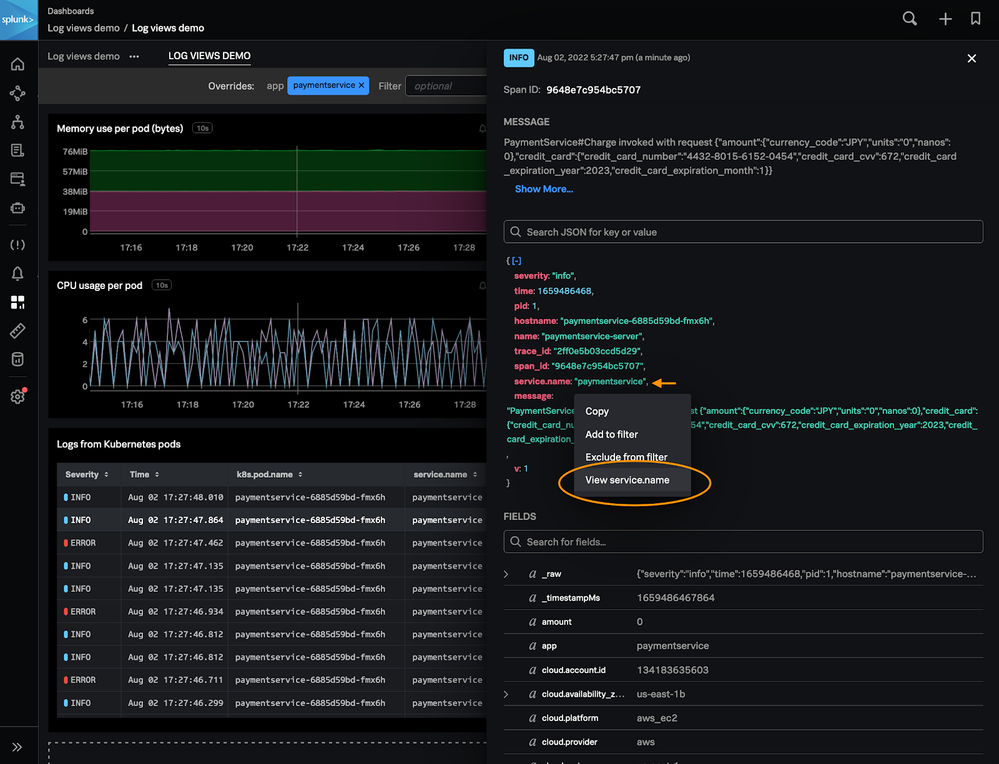
Step #3: Log views connect the logging power of the Splunk platform with the real-time metrics of Splunk Observability. With both Log Observer and Log Observer Connect, customers can use log views to show a unified view of all their data sources in Splunk Observability dashboards. Instead of opening a new tab with Splunk Enterprise or Splunk Log Observer to start searching, by adding a log view to your dashboard, you can now see relevant logs from your service right there on the page. From this dashboard, jump across related content to drill down on instances for deep root cause analysis - all while centralizing log data on a familiar extensible data platform.
Pro-tip: Log views work best when the logs contain some field names in common with the dimensions or properties of the other metrics on the dashboard. To ensure your dashboard-level filters work well across all the data you need to show, make use of Logs Field Aliasing.
Use metrics to find logs, and use logs to explain metrics today with log views in Splunk Observability dashboards. To learn more about log views, signup for a free trial and check out our technical documentation.
— Collin Chau, Lead Infrastructure Observability, Product Marketing
You must be a registered user to add a comment. If you've already registered, sign in. Otherwise, register and sign in.
Join Us for Splunk University and Get Your Bootcamp Game On!
.conf24 | Learning Tracks for Security, Observability, Platform, and Developers!
Announcing Scheduled Export GA for Dashboard Studio
-
Customer Experience
9 -
Data Stream Processor
1 -
Edge Processor
2 -
OpenTelemetry
1 -
other
7 -
Product Announcements
1 -
Splunk APM
20 -
Splunk Cloud Platform
62 -
Splunk Community
1 -
Splunk Enterprise
45 -
Splunk Enterprise Security
43 -
Splunk Infras Monitoring
17 -
Splunk ITSI
11 -
Splunk Lantern
1 -
Splunk Mission Control
4 -
Splunk Observability Cloud
78 -
Splunk On-Call
2 -
Splunk Security Cloud
21 -
Splunk SOAR
15 -
Splunk UBA
2 -
Splunkbase Apps & Add-Ons
16 -
User Groups
1
- « Previous
- Next »


