- News & Education
- :
- Blog & Announcements
- :
- Product News & Announcements
- :
- Explore Splunk Cloud Data in Splunk Observability ...
Explore Splunk Cloud Data in Splunk Observability with Log Observer Connect
- Subscribe to RSS Feed
- Mark as New
- Mark as Read
- Bookmark Topic
- Subscribe
- Printer Friendly Page
- Report Inappropriate Content
Hello Admins, Ops leaders, SREs, Developers, and anyone else reading this! In January we announced the availability of Splunk Log Observer Connect for Splunk Enterprise. We are enthusiastic to announce that Splunk Log Observer Connect is now also available for Splunk Cloud Platform!
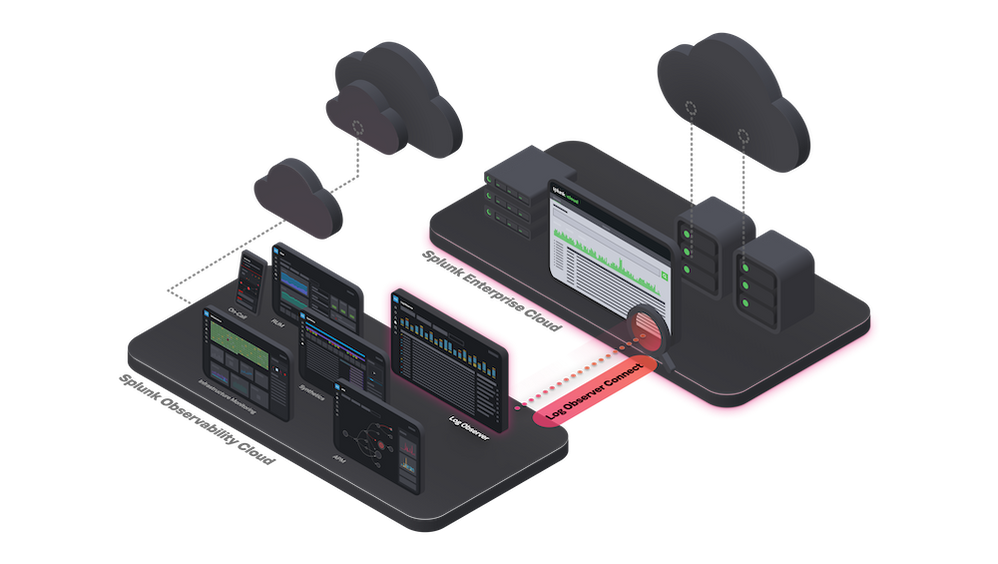
ICYMI: Log Observer Connect is a new feature that lets observability users (i.e. SRE, Developers, CloudOps folks) explore the data already being sent to existing Splunk instances with Splunk Log Observer’s intuitive no-code interface, enabling a unified view of metrics, traces, events and logs for faster troubleshooting, root-cause analysis and better cross-team collaboration (which ultimately leads to amazing customer experiences!)
- Check out this cool video we made about Log Observer Connect - Leverage the Power of Splunk Data in Splunk Observability Cloud
Why is this feature important?
You do a lot with log analytics. You leverage logs for compliance, to respond to security incidents, to investigate issues, to understand the behaviors of users, to put out fires, start fires, build cabins, and more. Logs and centralized log monitoring are critical components of an effective observability strategy but, for new cloud-native environments and microservices-based applications, logs alone are not enough for the real-time monitoring and troubleshooting required to maintain SLAs and deliver great user experiences from modern web/mobile apps. For complete visibility into customer experience and system health, teams need to leverage metric and trace data in context with log data to troubleshoot issues quickly, which is increasingly important as the cost of downtime and latency goes up.
All of Your Data in Splunk?! Yes, For Real:
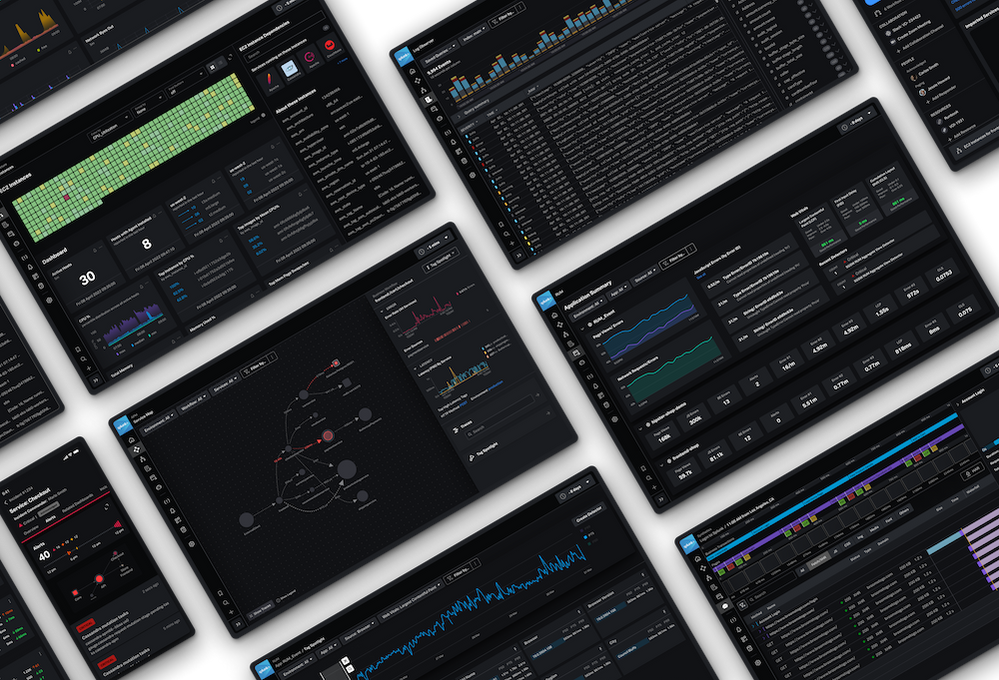
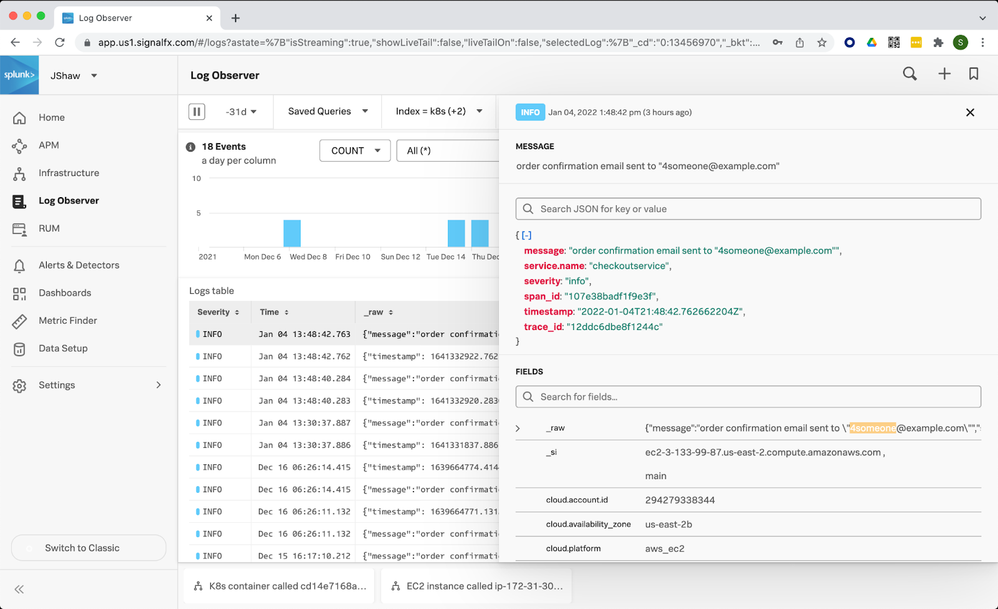
Splunk Observability gives SRE and DevOps teams the ability to analyze metrics, trace, event, and log data, all in context. Analyzing all telemetry data in one tool is important because for most of our Observability users if there is an issue with an application, they first go to the dashboard for that application in order to see the infrastructure metrics, application metrics, and related logs for fast insights. Users need to see the logs that correspond to a metric or trace (or chart or service map) directly within the same experience, without needing to be experts in a query language. This is where Log Observer Connect comes in, providing a log investigation experience integrated in Splunk Observability Cloud.
With Log Observer Connect, DevOps teams can troubleshoot application and infrastructure behavior in the integrated Splunk Observability Cloud using metrics, events and traces, then perform codeless queries on existing Splunk Enterprise and Splunk Cloud Platform logs to detect the root cause of problems in systems, without duplicating effort or moving to a different tool to search Splunk Cloud/Enterprise logs.
Log Observer Connect also allows users to streamline their observability data alongside their security, analytics, compliance, and other log data in Splunk Enterprise and Splunk Cloud. If you happen to be an existing Splunk Enterprise or Splunk Cloud customer who has Splunk Infrastructure Monitoring, Splunk APM, or Splunk Observability Cloud licenses, you can start using Log Observer Connect right away at no extra cost. With this integration, it’s easier than ever to consolidate tools and have centralized log management for improved observability and operations. And for more advanced investigations, post-incident reviews, and security, teams can leverage the power of Splunk Enterprise/Cloud.
With Log Observer Connect You Can:
- Centralize your data and data management. Different teams in your organization may be leveraging Splunk for different use cases or other tools. Simplify management and gain operational efficiencies with all of your data centralized on Splunk.
- Explore Splunk Enterprise data and Splunk Cloud Data, correlated with metrics and traces, through the integrated Log Observer interface to reduce MTTR and get more out of your data
- Get started quickly with minimal configuration changes, leveraging existing Splunk Universal Forwarder and technical add-ons (TAs) in addition to OpenTelemetry.
- Improve customer experiences. Access the no-code Log Observer experience and related content links for faster troubleshooting and root-cause analysis
- Extend the value of your existing investment at no additional cost. Use data from across your entire business, including the over 2400+ integrations available in Splunkbase to help bring in log data from any application.
Start Exploring Splunk Enterprise/Cloud Data in Log Observer. Check out the detailed instructions in our Log Observer documentation to begin!
Have increasingly complicated multi-cloud applications but lack visibility and insights into them?
If you haven’t explored Splunk’s Observability (O11y) portfolio yet, you can dive right in here or start a free trial to see how you can expand your use cases, make your operations better - and life easier, and run services with greater resiliency, scale, and efficiency.
Thanks for reading about the awesome new Log Observer Connect integration! Make sure to connect with us on what you’re most excited about! Make a comment below, if you'd like to share your feedback with us 😁.
Splunk has O11y you want and more! And, as Janet Jackson would say… it’s O11y for you.
— Nico Graham, PMM, Observability at Splunk
You must be a registered user to add a comment. If you've already registered, sign in. Otherwise, register and sign in.
Join Us for Splunk University and Get Your Bootcamp Game On!
.conf24 | Learning Tracks for Security, Observability, Platform, and Developers!
Announcing Scheduled Export GA for Dashboard Studio
-
Customer Experience
9 -
Data Stream Processor
1 -
Edge Processor
2 -
OpenTelemetry
1 -
other
7 -
Product Announcements
1 -
Splunk APM
20 -
Splunk Cloud Platform
62 -
Splunk Community
1 -
Splunk Enterprise
45 -
Splunk Enterprise Security
43 -
Splunk Infras Monitoring
17 -
Splunk ITSI
11 -
Splunk Lantern
1 -
Splunk Mission Control
4 -
Splunk Observability Cloud
78 -
Splunk On-Call
2 -
Splunk Security Cloud
21 -
Splunk SOAR
15 -
Splunk UBA
2 -
Splunkbase Apps & Add-Ons
16 -
User Groups
1
- « Previous
- Next »


