Are you a member of the Splunk Community?
- Find Answers
- :
- Using Splunk
- :
- Other Using Splunk
- :
- Other Usage
- :
- How to split alerts by error type?
- Subscribe to RSS Feed
- Mark Topic as New
- Mark Topic as Read
- Float this Topic for Current User
- Bookmark Topic
- Subscribe to Topic
- Mute Topic
- Printer Friendly Page
- Mark as New
- Bookmark Message
- Subscribe to Message
- Mute Message
- Subscribe to RSS Feed
- Permalink
- Report Inappropriate Content
How to split alerts by error type?
Sample events:
{
    errorClass:  NullPointerException
    userId: 53
},
{
    errorClass:  IllegalArgumentException
    userId: 65
},
{
    errorClass:  NullPointerException
    userId: 32
}
Instead of having one alert mixed with many different errors, I would like to create a new alert for every type of error:
Alert 1
{
    errorClass:  NullPointerException
    userId: 53
},
{
    errorClass:  NullPointerException
    userId: 32
}
Alert 2
{
    errorClass:  IllegalArgumentException
    userId: 65
}
Of course the number of errorClass can be infinite so we cannot create a dedicated alert for every errorClass. I want to try if something like:
{baseSearch} |stats by errorClass
and every row in the stats table can be a new alert is possible.
- Mark as New
- Bookmark Message
- Subscribe to Message
- Mute Message
- Subscribe to RSS Feed
- Permalink
- Report Inappropriate Content
Hi @YatMan,
you should try the option in alert creation "Trigger for each result" and run a search like this:
{baseSearch}
| stats count values(userId) AS userId BY errorClass
| where count>3
the last condition is mandatory if you need a threshold, otherwise you can avoid to use it.
if you want the error count for each userId, you can put this field in the BY clause:
{baseSearch}
| stats count BY errorClass userId
| where count>3
Ciao.
Giuseppe
- Mark as New
- Bookmark Message
- Subscribe to Message
- Mute Message
- Subscribe to RSS Feed
- Permalink
- Report Inappropriate Content
Thank you,
using | stat and"Trigger for each result" did send me unique alert for each error!
Is there a way I can attach the events in json format associated with each error in this alert?
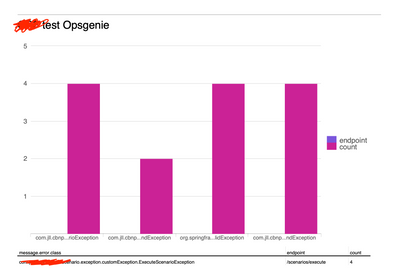
I don't need to see the graph, I want to see the list of associated events along with the alert.
The sample events I provided are of way simplified, we need the complete log (including stack trace, request Id , etc..) for onCall. I feel we are so close.
- Mark as New
- Bookmark Message
- Subscribe to Message
- Mute Message
- Subscribe to RSS Feed
- Permalink
- Report Inappropriate Content
Hi @YatMan,
you could add to the stats command, using the values option, the fields you need.
To see the row events is just a little complicated: you should use table comman instead stats and put the threshold in the alert editing.
Ciao.
Giuseppe
- Mark as New
- Bookmark Message
- Subscribe to Message
- Mute Message
- Subscribe to RSS Feed
- Permalink
- Report Inappropriate Content
Thanks for the reply. The reason we went with stats is so that we can group by error type. Not sure if the same can be done with table commands.
With the table approach, essentially what we are looking for is :
We create a table with 2 rows, so we get 2 alerts.
But each row has sub rows with the fields extracted from the events. The reason is so we can track which user at what time and what API etc
This also looks complicated, could you kindly point out if I am on the right direction?


