Join the Conversation
- Find Answers
- :
- Splunk Administration
- :
- Getting Data In
- :
- The TCP output processor has paused the data flow
- Subscribe to RSS Feed
- Mark Topic as New
- Mark Topic as Read
- Float this Topic for Current User
- Bookmark Topic
- Subscribe to Topic
- Mute Topic
- Printer Friendly Page
- Mark as New
- Bookmark Message
- Subscribe to Message
- Mute Message
- Subscribe to RSS Feed
- Permalink
- Report Inappropriate Content
The device sends the logs by means of syslog to the heavy forwarder who receives it, stores it and tries to send it to the indexers, but the errors that I attach appear.
Search head 1 Search Head2
↑ ↑
Index1 index2
↑ ↑
Heavy Forwarder Heavy Forwarder
Error 1:
09-07-2020 01:19:40.949 -0500 WARN TcpOutputProc - The TCP output processor has paused the data flow. Forwarding to host_dest=(ip of indexer) inside output group default-autolb-group from host_src=(ip folder source) has been blocked for blocked_seconds=100. This can stall the data flow towards indexing and other network outputs. Review the receiving system's health in the Splunk Monitoring Console. It is probably not accepting data.
Error 2
09-07-2020 10:50:05.169 -0500 WARN TailReader - Enqueuing a very large file=/xxx/xxx/xxxxxx/2020/09/07/user.log in the batch reader, with bytes_to_read=1846637230, reading of other large files could be delayed
All
- Mark as New
- Bookmark Message
- Subscribe to Message
- Mute Message
- Subscribe to RSS Feed
- Permalink
- Report Inappropriate Content
If you didn’t found anyone here, then you should contact your local splunk partner or directly to splunk PS to get help with this.
r. Ismo
- Mark as New
- Bookmark Message
- Subscribe to Message
- Mute Message
- Subscribe to RSS Feed
- Permalink
- Report Inappropriate Content
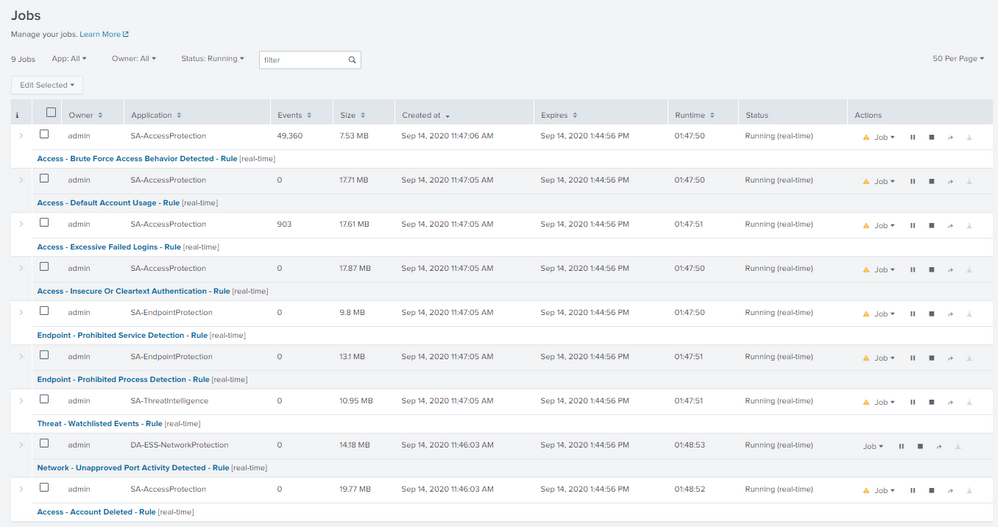
@isoutamo these are the jobs that I see in real time
317 results with this query 😅
| rest splunk_server=local /servicesNS/-/-/saved/searches
| search is_scheduled=1 disabled=0
| fields dispatch.earliest_time dispatch.latest_time eai:acl.owner eai:acl.sharing search cron_schedule title
| rename dispatch.earliest_time as earliest_time, dispatch.latest_time as latest_time, eai:acl.owner as owner, eai:acl.sharing as sharing
| table title cron_schedule earliest_time latest_time schedule_window owner sharing
cron_schedule 0 * * * * = 149
| title | cron_schedule |
| Audit - Script Errors | 0 * * * * |
| Endpoint - High Number Of Infected Hosts - Rule | 0 * * * * |
| Endpoint - Update Signature Reference - Lookup Gen | 0 * * * * |
| ESCU - Access LSASS Memory for Dump Creation - Rule | 0 * * * * |
| ESCU - Attempt To Add Certificate To Untrusted Store - Rule | 0 * * * * |
| ESCU - Attempt To Set Default PowerShell Execution Policy To Unrestricted or Bypass - Rule | 0 * * * * |
| ESCU - Attempt To Stop Security Service - Rule | 0 * * * * |
| ESCU - Attempted Credential Dump From Registry via Reg exe - Rule | 0 * * * * |
| ESCU - Batch File Write to System32 - Rule | 0 * * * * |
| ESCU - Child Processes of Spoolsv exe - Rule | 0 * * * * |
| ESCU - Clients Connecting to Multiple DNS Servers - Rule | 0 * * * * |
| ESCU - Common Ransomware Extensions - Rule | 0 * * * * |
| ESCU - Common Ransomware Notes - Rule | 0 * * * * |
| ESCU - Create local admin accounts using net exe - Rule | 0 * * * * |
| ESCU - Create or delete windows shares using net exe - Rule | 0 * * * * |
| ESCU - Create Remote Thread into LSASS - Rule | 0 * * * * |
| ESCU - Creation of Shadow Copy - Rule | 0 * * * * |
| ESCU - Creation of Shadow Copy with wmic and powershell - Rule | 0 * * * * |
| ESCU - Credential Dumping via Copy Command from Shadow Copy - Rule | 0 * * * * |
| ESCU - Credential Dumping via Symlink to Shadow Copy - Rule | 0 * * * * |
| ESCU - Deleting Shadow Copies - Rule | 0 * * * * |
| ESCU - Detect Activity Related to Pass the Hash Attacks - Rule | 0 * * * * |
| ESCU - Detect API activity from users without MFA - Rule | 0 * * * * |
| ESCU - Detect attackers scanning for vulnerable JBoss servers - Rule | 0 * * * * |
| ESCU - Detect Credential Dumping through LSASS access - Rule | 0 * * * * |
| ESCU - Detect DNS requests to Phishing Sites leveraging EvilGinx2 - Rule | 0 * * * * |
| ESCU - Detect Excessive Account Lockouts From Endpoint - Rule | 0 * * * * |
| ESCU - Detect Excessive User Account Lockouts - Rule | 0 * * * * |
| ESCU - Detect hosts connecting to dynamic domain providers - Rule | 0 * * * * |
| ESCU - Detect Long DNS TXT Record Response - Rule | 0 * * * * |
| ESCU - Detect malicious requests to exploit JBoss servers - Rule | 0 * * * * |
| ESCU - Detect Mimikatz Using Loaded Images - Rule | 0 * * * * |
| ESCU - Detect Mimikatz Via PowerShell And EventCode 4703 - Rule | 0 * * * * |
| ESCU - Detect mshta exe running scripts in command-line arguments - Rule | 0 * * * * |
| ESCU - Detect new API calls from user roles - Rule | 0 * * * * |
| ESCU - Detect New Local Admin account - Rule | 0 * * * * |
| ESCU - Detect New Login Attempts to Routers - Rule | 0 * * * * |
| ESCU - Detect New Open S3 buckets - Rule | 0 * * * * |
| ESCU - Detect Oulook exe writing a zip file - Rule | 0 * * * * |
| ESCU - Detect Path Interception By Creation Of program exe - Rule | 0 * * * * |
| ESCU - Detect processes used for System Network Configuration Discovery - Rule | 0 * * * * |
| ESCU - Detect Prohibited Applications Spawning cmd exe - Rule | 0 * * * * |
| ESCU - Detect PsExec With accepteula Flag - Rule | 0 * * * * |
| ESCU - Detect S3 access from a new IP - Rule | 0 * * * * |
| ESCU - Detect Spike in Network ACL Activity - Rule | 0 * * * * |
| ESCU - Detect Spike in S3 Bucket deletion - Rule | 0 * * * * |
| ESCU - Detect Spike in Security Group Activity - Rule | 0 * * * * |
| ESCU - Detect Unauthorized Assets by MAC address - Rule | 0 * * * * |
| ESCU - Detect USB device insertion - Rule | 0 * * * * |
| ESCU - Detect Use of cmd exe to Launch Script Interpreters - Rule | 0 * * * * |
| ESCU - Detect web traffic to dynamic domain providers - Rule | 0 * * * * |
| ESCU - Detection of DNS Tunnels - Rule | 0 * * * * |
| ESCU - Detection of tools built by NirSoft - Rule | 0 * * * * |
| ESCU - Disabling Remote User Account Control - Rule | 0 * * * * |
| ESCU - DNS Query Length Outliers - MLTK - Rule | 0 * * * * |
| ESCU - DNS Query Length With High Standard Deviation - Rule | 0 * * * * |
| ESCU - DNS Query Requests Resolved by Unauthorized DNS Servers - Rule | 0 * * * * |
| ESCU - DNS record changed - Rule | 0 * * * * |
| ESCU - Dump LSASS via comsvcs DLL - Rule | 0 * * * * |
| ESCU - Email Attachments With Lots Of Spaces - Rule | 0 * * * * |
| ESCU - Email files written outside of the Outlook directory - Rule | 0 * * * * |
| ESCU - Email servers sending high volume traffic to hosts - Rule | 0 * * * * |
| ESCU - Excessive DNS Failures - Rule | 0 * * * * |
| ESCU - Execution of File with Multiple Extensions - Rule | 0 * * * * |
| ESCU - Execution of File With Spaces Before Extension - Rule | 0 * * * * |
| ESCU - Extended Period Without Successful Netbackup Backups - Rule | 0 * * * * |
| ESCU - File with Samsam Extension - Rule | 0 * * * * |
| ESCU - First Time Seen Child Process of Zoom - Rule | 0 * * * * |
| ESCU - First time seen command line argument - Rule | 0 * * * * |
| ESCU - First Time Seen Running Windows Service - Rule | 0 * * * * |
| ESCU - GCP GCR container uploaded - Rule | 0 * * * * |
| ESCU - GCP Kubernetes cluster scan detection - Rule | 0 * * * * |
| ESCU - Hiding Files And Directories With Attrib exe - Rule | 0 * * * * |
| ESCU - Hosts receiving high volume of network traffic from email server - Rule | 0 * * * * |
| ESCU - Identify New User Accounts - Rule | 0 * * * * |
| ESCU - Kerberoasting spn request with RC4 encryption - Rule | 0 * * * * |
| ESCU - Large Volume of DNS ANY Queries - Rule | 0 * * * * |
| ESCU - MacOS - Re-opened Applications - Rule | 0 * * * * |
| ESCU - Malicious PowerShell Process - Connect To Internet With Hidden Window - Rule | 0 * * * * |
| ESCU - Malicious PowerShell Process - Encoded Command - Rule | 0 * * * * |
| ESCU - Malicious PowerShell Process - Execution Policy Bypass - Rule | 0 * * * * |
| ESCU - Malicious PowerShell Process - Multiple Suspicious Command-Line Arguments - Rule | 0 * * * * |
| ESCU - Malicious PowerShell Process With Obfuscation Techniques - Rule | 0 * * * * |
| ESCU - Monitor DNS For Brand Abuse - Rule | 0 * * * * |
| ESCU - Monitor Email For Brand Abuse - Rule | 0 * * * * |
| ESCU - Monitor Registry Keys for Print Monitors - Rule | 0 * * * * |
| ESCU - Monitor Web Traffic For Brand Abuse - Rule | 0 * * * * |
| ESCU - No Windows Updates in a time frame - Rule | 0 * * * * |
| ESCU - Open Redirect in Splunk Web - Rule | 0 * * * * |
| ESCU - Osquery pack - ColdRoot detection - Rule | 0 * * * * |
| ESCU - Overwriting Accessibility Binaries - Rule | 0 * * * * |
| ESCU - Process Execution via WMI - Rule | 0 * * * * |
| ESCU - Processes created by netsh - Rule | 0 * * * * |
| ESCU - Processes launching netsh - Rule | 0 * * * * |
| ESCU - Processes Tapping Keyboard Events - Rule | 0 * * * * |
| ESCU - Prohibited Network Traffic Allowed - Rule | 0 * * * * |
| ESCU - Prohibited Software On Endpoint - Rule | 0 * * * * |
| ESCU - Protocol or Port Mismatch - Rule | 0 * * * * |
| ESCU - Protocols passing authentication in cleartext - Rule | 0 * * * * |
| ESCU - Reg exe Manipulating Windows Services Registry Keys - Rule | 0 * * * * |
| ESCU - Reg exe used to hide files directories via registry keys - Rule | 0 * * * * |
| ESCU - Registry Keys for Creating SHIM Databases - Rule | 0 * * * * |
| ESCU - Registry Keys Used For Persistence - Rule | 0 * * * * |
| ESCU - Registry Keys Used For Privilege Escalation - Rule | 0 * * * * |
| ESCU - Remote Desktop Network Bruteforce - Rule | 0 * * * * |
| ESCU - Remote Desktop Network Traffic - Rule | 0 * * * * |
| ESCU - Remote Desktop Process Running On System - Rule | 0 * * * * |
| ESCU - Remote Process Instantiation via WMI - Rule | 0 * * * * |
| ESCU - Remote Registry Key modifications - Rule | 0 * * * * |
| ESCU - Remote WMI Command Attempt - Rule | 0 * * * * |
| ESCU - RunDLL Loading DLL By Ordinal - Rule | 0 * * * * |
| ESCU - Samsam Test File Write - Rule | 0 * * * * |
| ESCU - Sc exe Manipulating Windows Services - Rule | 0 * * * * |
| ESCU - Scheduled Task Name Used by Dragonfly Threat Actors - Rule | 0 * * * * |
| ESCU - Scheduled tasks used in BadRabbit ransomware - Rule | 0 * * * * |
| ESCU - Schtasks scheduling job on remote system - Rule | 0 * * * * |
| ESCU - Schtasks used for forcing a reboot - Rule | 0 * * * * |
| ESCU - Script Execution via WMI - Rule | 0 * * * * |
| ESCU - Shim Database File Creation - Rule | 0 * * * * |
| ESCU - Shim Database Installation With Suspicious Parameters - Rule | 0 * * * * |
| ESCU - Short Lived Windows Accounts - Rule | 0 * * * * |
| ESCU - Single Letter Process On Endpoint - Rule | 0 * * * * |
| ESCU - SMB Traffic Spike - MLTK - Rule | 0 * * * * |
| ESCU - SMB Traffic Spike - Rule | 0 * * * * |
| ESCU - Spectre and Meltdown Vulnerable Systems - Rule | 0 * * * * |
| ESCU - Spike in File Writes - Rule | 0 * * * * |
| ESCU - SQL Injection with Long URLs - Rule | 0 * * * * |
| ESCU - Suspicious Changes to File Associations - Rule | 0 * * * * |
| ESCU - Suspicious Email - UBA Anomaly - Rule | 0 * * * * |
| ESCU - Suspicious Email Attachment Extensions - Rule | 0 * * * * |
| ESCU - Suspicious File Write - Rule | 0 * * * * |
| ESCU - Suspicious LNK file launching a process - Rule | 0 * * * * |
| ESCU - Suspicious wevtutil Usage - Rule | 0 * * * * |
| ESCU - System Processes Run From Unexpected Locations - Rule | 0 * * * * |
| ESCU - TOR Traffic - Rule | 0 * * * * |
| ESCU - Uncommon Processes On Endpoint - Rule | 0 * * * * |
| ESCU - Unload Sysmon Filter Driver - Rule | 0 * * * * |
| ESCU - Unusually Long Command Line - MLTK - Rule | 0 * * * * |
| ESCU - Unusually Long Command Line - Rule | 0 * * * * |
| ESCU - USN Journal Deletion - Rule | 0 * * * * |
| ESCU - Web Fraud - Password Sharing Across Accounts - Rule | 0 * * * * |
| ESCU - Web Servers Executing Suspicious Processes - Rule | 0 * * * * |
| ESCU - Windows Event Log Cleared - Rule | 0 * * * * |
| ESCU - Windows hosts file modification - Rule | 0 * * * * |
| ESCU - WMI Permanent Event Subscription - Rule | 0 * * * * |
| ESCU - WMI Permanent Event Subscription - Sysmon - Rule | 0 * * * * |
| ESCU - WMI Temporary Event Subscription - Rule | 0 * * * * |
| Threat - Refresh Governance - Administrative | 0 * * * * |
| Threat - Refresh Reviewstatuses - Administrative | 0 * * * * |
- Mark as New
- Bookmark Message
- Subscribe to Message
- Mute Message
- Subscribe to RSS Feed
- Permalink
- Report Inappropriate Content
If you didn’t found anyone here, then you should contact your local splunk partner or directly to splunk PS to get help with this.
r. Ismo
- Mark as New
- Bookmark Message
- Subscribe to Message
- Mute Message
- Subscribe to RSS Feed
- Permalink
- Report Inappropriate Content
thanks for your help
- Mark as New
- Bookmark Message
- Subscribe to Message
- Mute Message
- Subscribe to RSS Feed
- Permalink
- Report Inappropriate Content
That error means that for some reason your indexer didn’t want to receive more logs to indexing those before it has managed what it is currently doing. What this is can be found with monitoring console. If you have installed it as distributed mode then you can easily check that from one place otherwise you must check it one by one. You could found MC under Settings. Then select indexing performance (individual node) and you see where the bottle neck is. If needed look also from resources items.
r. Ismo
- Mark as New
- Bookmark Message
- Subscribe to Message
- Mute Message
- Subscribe to RSS Feed
- Permalink
- Report Inappropriate Content
Hello, thank you very much for your answer
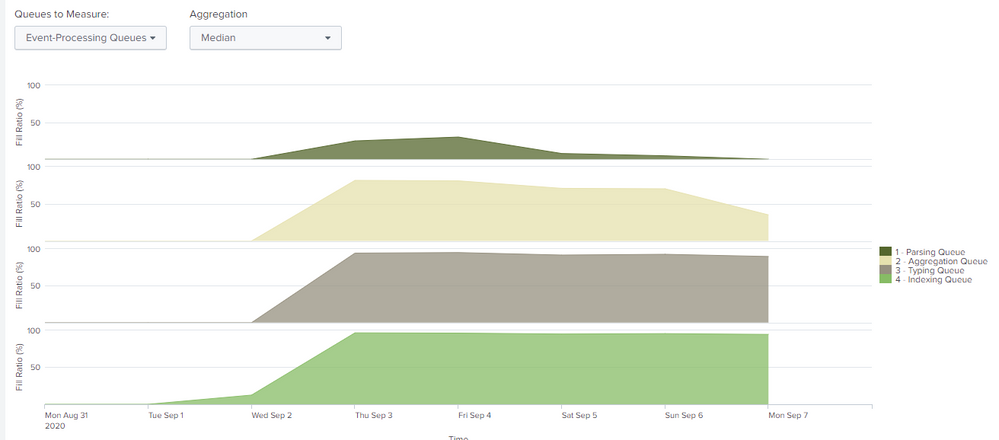
This is the information that appears, the last time that the log came from the heavy forwarder to the indexers was on September 3
According to these graphs, what could be analyzed?
- Mark as New
- Bookmark Message
- Subscribe to Message
- Mute Message
- Subscribe to RSS Feed
- Permalink
- Report Inappropriate Content
This last picture shows that you have full indexing queue which then blocks all other queues and also input from HF. Can you also post status of your resource usage (Resource usage: Machine) for disk especially IOPS?
- Mark as New
- Bookmark Message
- Subscribe to Message
- Mute Message
- Subscribe to RSS Feed
- Permalink
- Report Inappropriate Content
Sorry
- Mark as New
- Bookmark Message
- Subscribe to Message
- Mute Message
- Subscribe to RSS Feed
- Permalink
- Report Inappropriate Content
- Mark as New
- Bookmark Message
- Subscribe to Message
- Mute Message
- Subscribe to RSS Feed
- Permalink
- Report Inappropriate Content
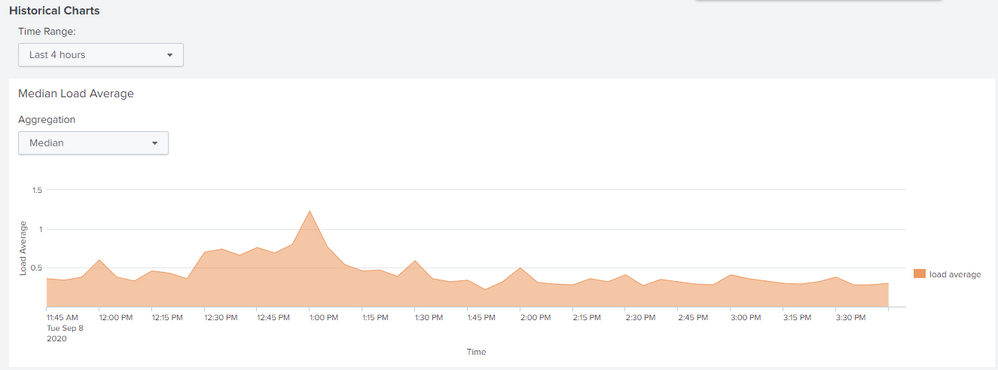
Done
I clarify that this image is from the search head
- Mark as New
- Bookmark Message
- Subscribe to Message
- Mute Message
- Subscribe to RSS Feed
- Permalink
- Report Inappropriate Content
- Mark as New
- Bookmark Message
- Subscribe to Message
- Mute Message
- Subscribe to RSS Feed
- Permalink
- Report Inappropriate Content
- Mark as New
- Bookmark Message
- Subscribe to Message
- Mute Message
- Subscribe to RSS Feed
- Permalink
- Report Inappropriate Content
This show how utilised your I/O systems is. Also Service Time and Wait Times are good to know.
- Mark as New
- Bookmark Message
- Subscribe to Message
- Mute Message
- Subscribe to RSS Feed
- Permalink
- Report Inappropriate Content
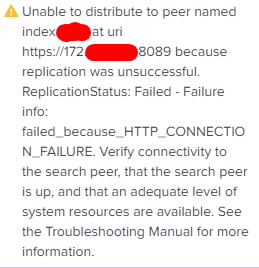
I have not been able to share the information since the monitor is not showing me data now 😥
"Search results might be incomplete: the search process on the peer:indexxxxx ended prematurely. Check the peer log, such as $SPLUNK_HOME/var/log/splunk/splunkd.log and as well as the search.log for the particular search."
- Mark as New
- Bookmark Message
- Subscribe to Message
- Mute Message
- Subscribe to RSS Feed
- Permalink
- Report Inappropriate Content
So my proposal is that you must get more disk IOPS. Is this a new disk, new host or what is depending on your system.
r. Ismo
- Mark as New
- Bookmark Message
- Subscribe to Message
- Mute Message
- Subscribe to RSS Feed
- Permalink
- Report Inappropriate Content
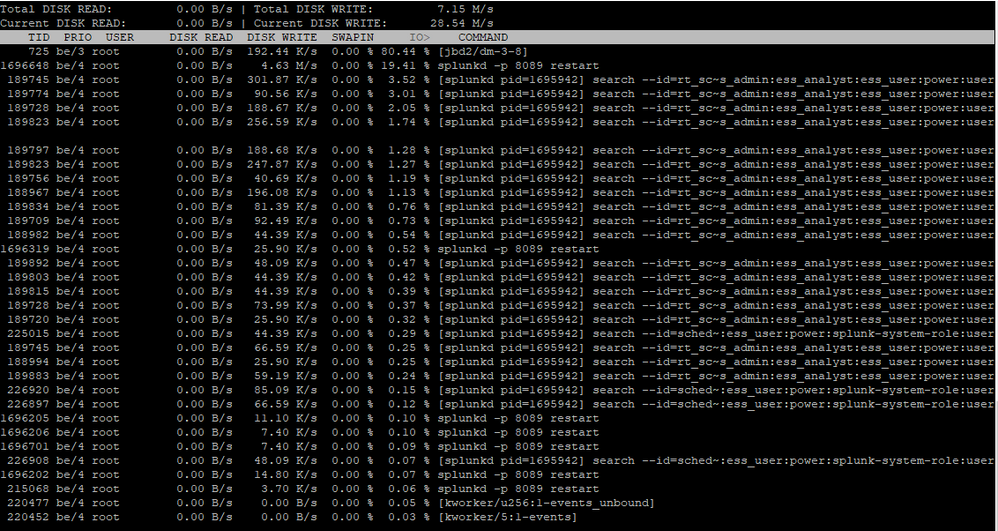
Because I cannot see IOPS in the Monitor Console, I did the validation directly from linux with the command iotop -o
Splunk Enterprise Security =High use of IOPS
Indexer = High use of IOPS
indexer2 = High use of IOPS
HF = Low use
HF = Low use
I see that the server is a virtual machine, should I request that IOPS be increased in WM?
- Mark as New
- Bookmark Message
- Subscribe to Message
- Mute Message
- Subscribe to RSS Feed
- Permalink
- Report Inappropriate Content
R. Ismo
- Mark as New
- Bookmark Message
- Subscribe to Message
- Mute Message
- Subscribe to RSS Feed
- Permalink
- Report Inappropriate Content
I do not have control of the physical or local infrastructure, I only have access to the servers.


