Join the Conversation
- Find Answers
- :
- Splunk Administration
- :
- Getting Data In
- :
- Splunk - How to convert Logs to Metrics (SQL Add o...
- Subscribe to RSS Feed
- Mark Topic as New
- Mark Topic as Read
- Float this Topic for Current User
- Bookmark Topic
- Subscribe to Topic
- Mute Topic
- Printer Friendly Page
- Mark as New
- Bookmark Message
- Subscribe to Message
- Mute Message
- Subscribe to RSS Feed
- Permalink
- Report Inappropriate Content
Splunk - How to convert Logs to Metrics (SQL Add on)?
Hi,
I am trying to get SQL Performance monitoring logs into our environment for one of our ITSI use cases
The event successfully comes into our event index however I would like to convert these performance monitoring sql logs into metrics as it will work much better with ITSI
I am struggling to convert the logs into metrics and am using the following documentation to help me do so -
https://docs.splunk.com/Documentation/Splunk/9.0.1/Data/Extractfieldsfromfileswithstructureddata
Here are my props and transforms conf files for 1 of the sql perfmon inputs
props.conf
[Perfmon:sqlserverhost:physicaldisk]
TRANSFORMS-field_value = field_extraction
TRANSFORMS-sqlphysicaldiskmetrics = eval_sqlphysicaldiskcounter
METRIC-SCHEMA-TRANSFORMS = metric-schema:extract_sqlphysicaldisk
transforms.conf
[eval_sqlphysicaldiskcounter]
INGEST_EVAL = metric_name=counter

[metric-schema:extract_sqlphysicaldisk]
METRIC-SCHEMA-MEASURES = _ALLNUMS_
My SQL index where i would like these logs to go into does not have the "datatype=metrics" setting as i thought this should convert the events into metrics regardless, also i changed this setting so that the datatype = metrics but this removed all the data entirely and no data was populated into the sql index
I can still see the event data populating in the SQL index but it cannot be searched using the metrics commands (mstats, mcatalog etc)
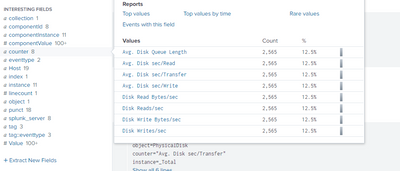
Note - There are 8 counter field values which i would like to convert individually into metrics hence why i set the metric_name = counter. I did not break it down individually into separate settings under the transforms.conf due to there being spaces in the field values
Any idea why this is failing and how i can fix this? Any help would be greatly appreciated!
Any questions please ask!
Thanks
- Mark as New
- Bookmark Message
- Subscribe to Message
- Mute Message
- Subscribe to RSS Feed
- Permalink
- Report Inappropriate Content
Hey @ssj3abid , were you able to figure this out? I'm having the same issues.

