- Splunk Answers
- :
- Using Splunk
- :
- Dashboards & Visualizations
- :
- How to know the number of events processed in a da...
- Subscribe to RSS Feed
- Mark Topic as New
- Mark Topic as Read
- Float this Topic for Current User
- Bookmark Topic
- Subscribe to Topic
- Mute Topic
- Printer Friendly Page
- Mark as New
- Bookmark Message
- Subscribe to Message
- Mute Message
- Subscribe to RSS Feed
- Permalink
- Report Inappropriate Content
How to know the number of events processed in a dashboard?
Question1. I have a dashboard with multiple timecharts type query running with different logic and different preset times.
I want to know how many events were processed as a part of that chart to run. And if possible can I have that value see in that same dashboard?
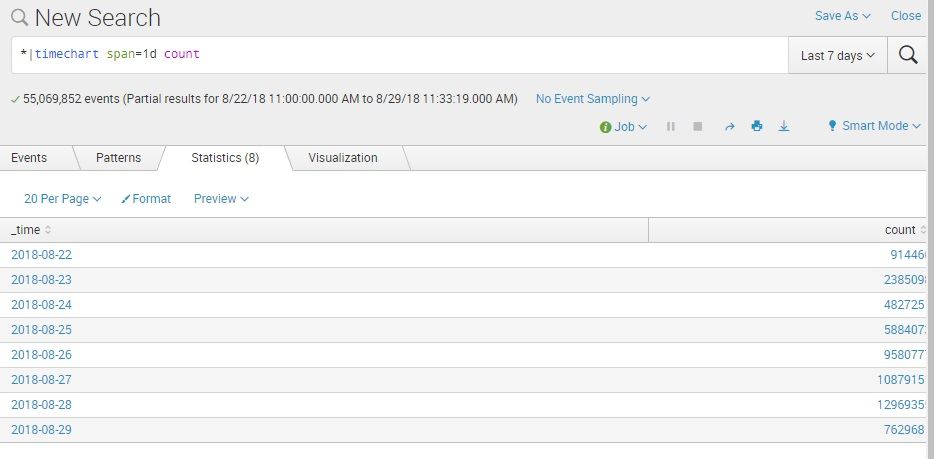
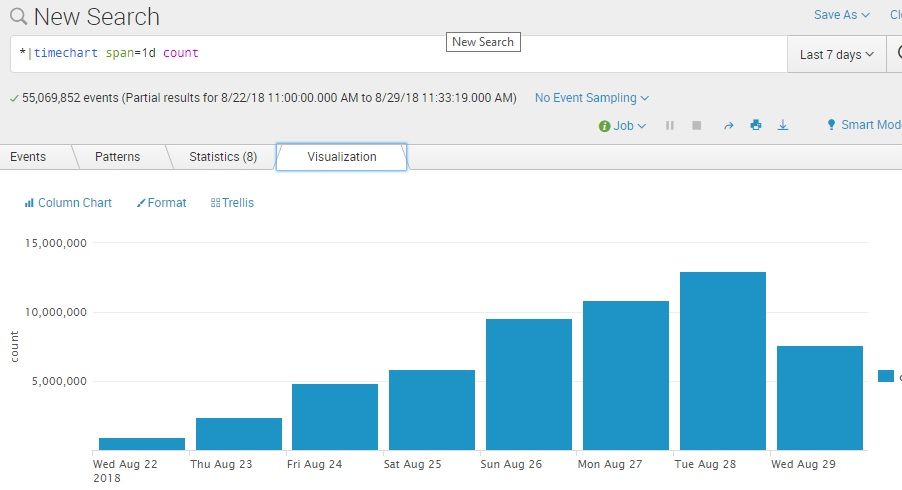
Question2. I want a query that should be able to tell me how many events are there in a specific time period I choose. e.g. 25th Aug from 10 to 14 or something like 15th August all day. possibly in a timechart visualization like monday = 30000 events, tuesday = 45666 events .....etc.. in a line chart
- Mark as New
- Bookmark Message
- Subscribe to Message
- Mute Message
- Subscribe to RSS Feed
- Permalink
- Report Inappropriate Content
- Mark as New
- Bookmark Message
- Subscribe to Message
- Mute Message
- Subscribe to RSS Feed
- Permalink
- Report Inappropriate Content
Thanks @inventsekar . Any idea about the first question?
How do I know the number of events processed to have the chart run ?
- Mark as New
- Bookmark Message
- Subscribe to Message
- Mute Message
- Subscribe to RSS Feed
- Permalink
- Report Inappropriate Content
After a query has run and given me an output in a chart in a dashboard. How do I know the number of events that were processed for that SPL query. @inventsekar
- Mark as New
- Bookmark Message
- Subscribe to Message
- Mute Message
- Subscribe to RSS Feed
- Permalink
- Report Inappropriate Content
i am not much getting your query...
maybe, you can copy paste the dashboard query..
or, you can create an alert with the same splunk query and email you the results..
- Mark as New
- Bookmark Message
- Subscribe to Message
- Mute Message
- Subscribe to RSS Feed
- Permalink
- Report Inappropriate Content
@inventsekar Let me give an example.
There is timechart query running in my dashboard and the query essentially gives me the average response time of requests with a span=1d over last 24 hours in a line chart format. And the query runs absolutely fine with no error.
What I am interested here to know is, "as a part of this query execution how many events were processed" ? OR what are the number of events that were used by the query ?


