- Find Answers
- :
- Using Splunk
- :
- Splunk Search
- :
- timechart mistakes
- Subscribe to RSS Feed
- Mark Topic as New
- Mark Topic as Read
- Float this Topic for Current User
- Bookmark Topic
- Subscribe to Topic
- Mute Topic
- Printer Friendly Page
- Mark as New
- Bookmark Message
- Subscribe to Message
- Mute Message
- Subscribe to RSS Feed
- Permalink
- Report Inappropriate Content
timechart mistakes
I am getting the events from an Australian timeline. But time running in my laptop is IST. So, when i try to calculate the events from today beginning i.e., 12:00 am to latest now with span of 3h. i having my stats showing the timechart starts from yesterday 10pm. I don't understand the mistake. But above the results it showing the events from 8,sep,2021 00:00:00 to 8, sep,2021 13:53:12(now). But i Don't know why it is starting to show from 10 pm yesterday. I calculating the avg of the results of particular field.
- Mark as New
- Bookmark Message
- Subscribe to Message
- Mute Message
- Subscribe to RSS Feed
- Permalink
- Report Inappropriate Content
"I am getting the events from an Australian timeline. But time running in my laptop is IST".
OK. Let's stop here.
On ingest an event is getting assigned a _time field (the timestamp associated with the event). It might be parsed out from the message (if it's provided within the message and the source/sourcetype/host definition tells splunk how to do so) or might be associated with the time the event arrived on input. What's important is that the timestamp associated with the message is internally represented as ane epoch timestamp. On its own it doesn't have any information about timezone so it's up to the ingesting logic to appropriately convert timestamp from the event (which might be in local timezone, might have a timezone specification included in the event but might not).
So the first and most important thing in getting your data into splunk is to make sure that the events are getting parsed and timestamped properly.
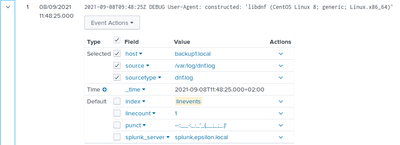
Remember though that what you see as _time value might not directly be the same as the value included in the event. For example (from my home installation):
Here you can see that the event has a timestamp saying 9:48:52Z. In this case Z means Zulu time (GMT) so it's getting properly parsed and displayed in _time fielda as 11:48:52+02:00.
And here is where we get to the other part of time magic in splunk - splunk web ui shows and calculates times according to your preferences. In my case - I'm situated in GMT+2 area so all timestamps are presented as +02:00. If I were to change my timezone, the same event would still show "9:48:52Z" in the original event _raw data but might be presented in _time field as 12:48:52+04:00 or 6:48:52-03:00. But it would be still be the same timestamp, just converted to the user's timezone.
So one thing is that you might be seeing events that have a local timestamp from a source timezone included in the raw event data but are getting parsed into proper timezone and are getting properly indexed at the right time. Just expand an event from your result set and verify whether it's getting indexed at the proper time. If it is then everything is working OK, if not - you have to repair your ingest process.
But the other thing is that your search timerange also gets converted to a timestamp range according to your user's timezone settings. So if your user has GMT+2 timezone as default and you're looking for earliest=-1d@d latest=@d, you're effectively looking for a whole day from midnight till midnight _in your local timezone_ which is 10PM till 10PM GMT.
To sum up - the discrepancy between what you're getting and your expectations might be either due to bad timezone conversion on input or badly defined timezone on search.

