
Join the Conversation
- Find Answers
- :
- Using Splunk
- :
- Splunk Search
- :
- simplifying a (field extraction error) dashboard?
- Subscribe to RSS Feed
- Mark Topic as New
- Mark Topic as Read
- Float this Topic for Current User
- Bookmark Topic
- Subscribe to Topic
- Mute Topic
- Printer Friendly Page
- Mark as New
- Bookmark Message
- Subscribe to Message
- Mute Message
- Subscribe to RSS Feed
- Permalink
- Report Inappropriate Content

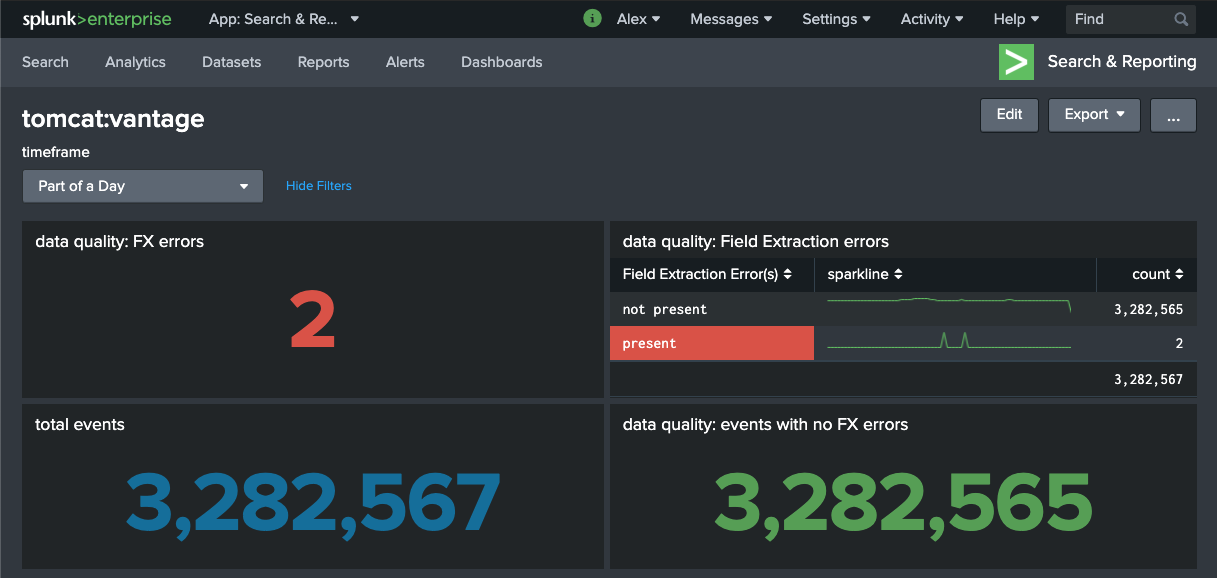
Possible to use the results of the same search in multiple panels on the same dashboard, and with different visualizations for them? (By the "same search" I mean: run it once, present results in several places via different means.)
Reason: make it faster, use less resources.
Example:

All four panels of the above dashboard use basically the same search that checks if a field message was extracted, and reports the stats highlighting the number of events where that field is not present.
Notes:
- Field message should be present in all events; if it's not - it's a field extraction error.
- The error is not necessarily the result of a bad field extraction regex - it could also be the result of a malformed event, event breaking too soon, etc.
- The top right panel is all that is needed - yet the other panels do help - I'd like to keep them there - although not at the expense of running multiple redundant searches.
The search:
sourcetype="some_sourcetype"
| eval "Field Extraction Error(s)" = if(isnull(message),"present","not present")
| stats sparkline count by "Field Extraction Error(s)"
Possible?
Thanks!
- Mark as New
- Bookmark Message
- Subscribe to Message
- Mute Message
- Subscribe to RSS Feed
- Permalink
- Report Inappropriate Content


Yes, it's possible. It's also common and recommended. Splunk calls it "post-processing" and you can read about it at https://docs.splunk.com/Documentation/Splunk/8.0.3/Viz/Savedsearches#Post-process_searches_2
If this reply helps you, Karma would be appreciated.
- Mark as New
- Bookmark Message
- Subscribe to Message
- Mute Message
- Subscribe to RSS Feed
- Permalink
- Report Inappropriate Content
Yes, it's possible. It's also common and recommended. Splunk calls it "post-processing" and you can read about it at https://docs.splunk.com/Documentation/Splunk/8.0.3/Viz/Savedsearches#Post-process_searches_2
If this reply helps you, Karma would be appreciated.

Join the Splunk Community Slack to learn, troubleshoot, and make connections with fellow Splunk practitioners in real time!
Join Splunk User Groups to connect and learn in-person by region or remotely by topic or industry.
[Puzzles] Solve, Learn, Reuse: Word-play
Tuning Edge Processor in Hybrid Mode: What Limits Each Data Path
Best Practices: Splunk auto adjust pipeline queue
