- Splunk Answers
- :
- Using Splunk
- :
- Splunk Search
- :
- Why is my time wrongly mapped whenever I tabulate...
- Subscribe to RSS Feed
- Mark Topic as New
- Mark Topic as Read
- Float this Topic for Current User
- Bookmark Topic
- Subscribe to Topic
- Mute Topic
- Printer Friendly Page
- Mark as New
- Bookmark Message
- Subscribe to Message
- Mute Message
- Subscribe to RSS Feed
- Permalink
- Report Inappropriate Content
Why is my time wrongly mapped whenever I tabulate the results from transactions?
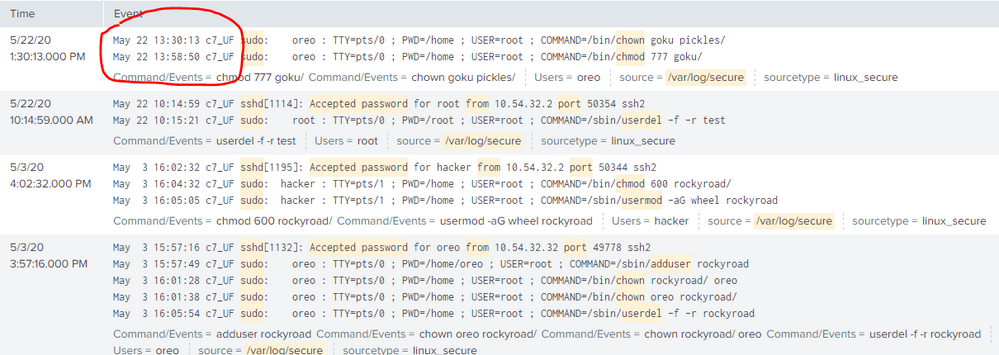
When I run this SPL, the transaction commands gives the correct output
index=* source=/var/log/secure* (TERM(sudo)  AND (TERM(adduser) OR TERM(chown) OR TERM(userdel) OR TERM(chmod) OR TERM(usermod) OR TERM(useradd))  AND COMMAND!="*egrep*")
OR (TERM(sshd) AND "Accepted password" AND TERM(from) AND TERM(port))
| regex _raw != ".*bin\/grep|.*bin\/man|.*bin\/which|.*bin\/less|.*bin\/more"
| rex field=_raw "(?<=sudo:)\s*(?P<Users>[[:alnum:]]\S*[[:alnum:]])\s*(?=\:).*(?<=COMMAND\=)(?P<command>.*)"
| rex field=_raw "(?<=for)\s*(?P<Users>[[:alnum:]]\S*[[:alnum:]])\s*(?=from).*(?<=from)\s*(?P<ip>[[:digit:]]+\.[[:digit:]]+\.[[:digit:]]+\.[[:digit:]]+)"
| eval "Command/Events" = replace(command,"^(\/bin\/|\/sbin\/)","")
| eval Time = if(match(_raw,"(?<=sudo:)\s*[[:alnum:]]\S*[[:alnum:]]\s*(?=\:).*(?<=COMMAND\=)*") ,strftime(_time, "%Y-%d-%m %H:%M:%S"),null())
| eval Date = strftime(_time, "%Y-%d-%m")
| eval "Report ID" = "ABLR-007"
| eval "Agency HF" = if(isnull(agencyhf),"",agencyhf)
| rename host as Hostname, index as Agency
| transaction Date Hostname Users Agency startswith="sshd"  maxevents=-1  keepevicted=true
| regex _raw = ".*sshd\:\n.*sudo\:|.*sudo\:"
Result:
Then when I tabulate the data using the SPL below, the time is wrong
index=* source=/var/log/secure* (TERM(sudo)  AND (TERM(adduser) OR TERM(chown) OR TERM(userdel) OR TERM(chmod) OR TERM(usermod) OR TERM(useradd))  AND COMMAND!="*egrep*")
OR (TERM(sshd) AND "Accepted password" AND TERM(from) AND TERM(port))
| regex _raw != ".*bin\/grep|.*bin\/man|.*bin\/which|.*bin\/less|.*bin\/more"
| rex field=_raw "(?<=sudo:)\s*(?P<Users>[[:alnum:]]\S*[[:alnum:]])\s*(?=\:).*(?<=COMMAND\=)(?P<command>.*)"
| rex field=_raw "(?<=for)\s*(?P<Users>[[:alnum:]]\S*[[:alnum:]])\s*(?=from).*(?<=from)\s*(?P<ip>[[:digit:]]+\.[[:digit:]]+\.[[:digit:]]+\.[[:digit:]]+)"
| eval "Command/Events" = replace(command,"^(\/bin\/|\/sbin\/)","")
| eval Time = if(match(_raw,"(?<=sudo:)\s*[[:alnum:]]\S*[[:alnum:]]\s*(?=\:).*(?<=COMMAND\=)*") ,strftime(_time, "%Y-%d-%m %H:%M:%S"),null())
| eval Date = strftime(_time, "%Y-%d-%m")
| eval "Report ID" = "ABLR-007"
| eval "Agency HF" = if(isnull(agencyhf),"",agencyhf)
| rename host as Hostname, index as Agency
| transaction Date Hostname Users Agency startswith="sshd"  maxevents=-1  keepevicted=true
| regex _raw = ".*sshd\:\n.*sudo\:|.*sudo\:"
| fields "Report ID" Time Agency Command/Events Hostname Users ip "Agency HF"
| rename ip as  "IP Address"
| eval multivalue_fields = mvzip(Time,'Command/Events')
| mvexpand multivalue_fields
| makemv multivalue_fields delim=","
| eval Time=mvindex(multivalue_fields , 0)
| eval "Command/Events"=mvindex(multivalue_fields , 1)
| table "Report ID" Time Agency Command/Events Hostname Users "IP Address" "Agency HF"
Result
** I also have tried using stats, yes I could combine the data with it. However, I can't use that as I would need to rely heavily on list(). the data sometimes exceeds 100 and the customer does not want me to touch limits.conf so I changed to transaction instead.
- Mark as New
- Bookmark Message
- Subscribe to Message
- Mute Message
- Subscribe to RSS Feed
- Permalink
- Report Inappropriate Content
Transaction creates multivalue fields, but they are not guaranteed to align as if they were produced by list. You are combining "Time" and "Command/Events", and the result is likely to be nonsense.
More importantly, transaction is resource-heavy and should be avoided in this context, where you plan to break the individual events right back out again.
Probably what you really need here is an initial collection of the events you want, then use eventstats and streamstats to group them and get the fields you are using transaction to get.


