- Splunk Answers
- :
- Using Splunk
- :
- Splunk Search
- :
- Why is my time token changing in a comparison time...
- Subscribe to RSS Feed
- Mark Topic as New
- Mark Topic as Read
- Float this Topic for Current User
- Bookmark Topic
- Subscribe to Topic
- Mute Topic
- Printer Friendly Page
- Mark as New
- Bookmark Message
- Subscribe to Message
- Mute Message
- Subscribe to RSS Feed
- Permalink
- Report Inappropriate Content
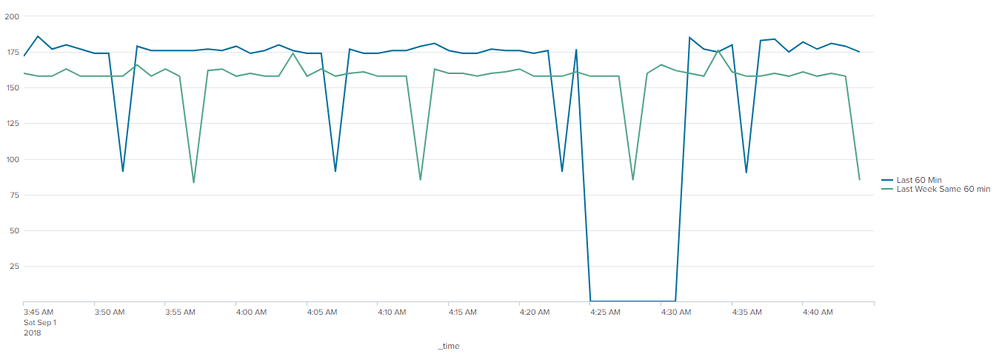
I successfully put together a graph that compares bandwidth consumption over a period of time (currently hardcoded to 60 minutes) with that of the previous week.
Now I'm having trouble hooking my query up with the time range picker on Splunk Dashboard:
My current query looks like:
```
index=xxx  earliest=-60m@m latest=-0m@m |eval period="today"
| append [search index=xxx  earliest=-10140m@m latest=-10080m@m | eval period="last_week"
| eval new_time=_time+(60*60*24*7)]
| eval _time=if(isnotnull(new_time), new_time, _time)
| timechart span=5m sum(bytes) by period
```
While researching how to, I found these posts:
https://answers.splunk.com/answers/453444/how-to-input-time-using-earliest-and-latest-tokens.html
https://answers.splunk.com/answers/475557/how-to-dynamically-compare-two-time-ranges.html
Then made the following changes:
```
index=xxx

    | eval earliest=if(isnum("$time_token.earliest$"), "$time_token.earliest$", relative_time(now(), "$time_token.earliest$"))
    | eval latest=if(isnum("$time_token.latest$"), "$time_token.latest$",  relative_time(now(), "$time_token.latest$"))
    | eval period="today"
    | append [search index=xxx |eval earlist=if(isnum("$time_token.earliest$"), relative_time("$time_token.earliest$", "-10080m@m"), relative_time(relative_time(now(), "$time_token.earliest$"), "-10080m@m"))
    | eval latest=if(isnum("$time_token.latest$"), relative_time("$time_token.latest$", "-10080m@m"),  relative_time(relative_time(now(), "$time_token.latest$"), "-10080m@m"))
    | eval period="last_week"
    | eval new_time=_time+(60*60*24*7)]
    | eval _time=if(isnotnull(new_time), new_time, _time)
    | timechart span=5m sum(bytes) by period
```
Unfortunately, my graph does not look right. It appears that it's in a 7 days time range, and it seems like they are sum up the same data bytes. See image below.
Anyone with ideas? Thanks in advance.
- Mark as New
- Bookmark Message
- Subscribe to Message
- Mute Message
- Subscribe to RSS Feed
- Permalink
- Report Inappropriate Content
@everynameIwantistaken, Ideal is to run two searches for the same time period and then adjust the time line of one of the searches so that it overlaps over the other one. In your case you seem to be trying to compare Today's last 60 min with Previous week same 60 min window.
Try the following run anywhere search based on Splunk's _internal index:
index=_internal sourcetype=splunkd log_level=INFO earliest=-60m@m latest=@m
| timechart span=1m count as "Last 60 Min"
| appendcols [search index=_internal sourcetype=splunkd log_level=INFO earliest=-7d@m-60m latest=-7d@m
| timechart span=1m count as "Last Week Same 60 min"
| eval _time=relative_time(_time,"+7d")]
Refer to this old but really good blog post on comparing two time ranges.
| makeresults | eval message= "Happy Splunking!!!"
- Mark as New
- Bookmark Message
- Subscribe to Message
- Mute Message
- Subscribe to RSS Feed
- Permalink
- Report Inappropriate Content
Thank you for the help. I saw the post, but my problem is like I want to show the graph in a dashboard and connect it with a time token so that I can compare today and last week with different time range .


