- Find Answers
- :
- Using Splunk
- :
- Splunk Search
- :
- Why is appendcols not working aligning values corr...
- Subscribe to RSS Feed
- Mark Topic as New
- Mark Topic as Read
- Float this Topic for Current User
- Bookmark Topic
- Subscribe to Topic
- Mute Topic
- Printer Friendly Page
- Mark as New
- Bookmark Message
- Subscribe to Message
- Mute Message
- Subscribe to RSS Feed
- Permalink
- Report Inappropriate Content
Hi!
I'd like to know if someone can help me with this:
I have 4 saved searches that gives back counts for WTD (Week-to-Date), MTD (Month), QTD (quarter) and YTD (year) per type and a dashboard that calls those 4 searches that would display as columns per branch:
Example:
Branch dropdown: Avenue1 <--- the dashboard will have this and the numbers will change accordingly.
WTD MTD QTD YTD
PROD type 1 4 0 85 85
PROD type 3 0 0 1 1
PROD type 40 1 0 6 6
...
Total 5 0 92 92
The Dashboard will have the following( I hardcoded the branch for now):
| loadjob savedsearch="....:search:Retail_TEST_QTD"
| rename CREATEDATBRANCH as Branch
| lookup BranchNums Branch
| search BranchNames="Avenue1"
| stats count(TOTALCOUNT) as QTD by DESCRIPTION
| appendcols
[| loadjob savedsearch="....:search:Retail_TEST_YTD"
| rename CREATEDATBRANCH as Branch
| lookup BranchNums Branch
| search BranchNames="Avenue1"
| stats count(TOTALCOUNT) as YTD by DESCRIPTION]
| appendcols
[| loadjob savedsearch="....:search:Retail_TEST_MTD"
| rename CREATEDATBRANCH as Branch
| lookup BranchNums Branch
| search BranchNames="Avenue1"
| stats count(TOTALCOUNT) as MTD by DESCRIPTION]
| appendcols
[| loadjob savedsearch="....:search:Retail_TEST_WTD"
| rename CREATEDATBRANCH as Branch
| lookup BranchNums Branch
| search BranchNames="Avenue1"
| stats count(TOTALCOUNT) as WTD by DESCRIPTION]
| rename DESCRIPTION as PROD_DESCRIPTION
| table PROD_DESCRIPTION WTD MTD QTD YTD
| addtotals row=f col=t labelfield=PROD_DESCRIPTION label="PROD Total:"
and these are the saved searches.
Saved search title: Retail_TEST_WTD
index=.... host=.... source=.... sourcetype=.... NOT CLOSEDATE=* AND
(TYPE = 1 OR TYPE = 2 OR TYPE = 3 OR TYPE = 4 OR TYPE = 5 OR TYPE = 6 OR
TYPE = 8 OR TYPE = 9 OR TYPE = 15 OR TYPE = 40 OR TYPE = 61 OR TYPE = 63)
| dedup PARENTACCOUNT ID
| eventstats count as TOTALCOUNT by TYPE, CREATEDATBRANCH
| eval OPENDATE=strptime(OPENDATE,"%Y-%m-%d %H:%M:%S.%Q")
| eval RANGE = "-1@w"
| where OPENDATE >= (relative_time(now(),RANGE))
| eval DESCRIPTION = case(TYPE=1, "PROD Type 1",
TYPE=2, "PROD Type 2",
TYPE=3, "PROD Type 3",
TYPE=4, "PROD Type 4",
TYPE=5, "PROD Type 5",
TYPE=6, "PROD Type 6",
TYPE=8, "PROD Type 8",
TYPE=9, "PROD Type 9",
TYPE=15, "PROD Type 15",
TYPE=40, "PROD Type 40",
TYPE=61, "PROD Type 61",
TYPE=63, "PROD Type 63")
Saved search title: Retail_TEST_MTD
| eval RANGE = "-1@mon" <--- same as above but with this change
Saved search title: Retail_TEST_QTD
| eval RANGE = "-1@qtr"
Saved search title: Retail_TEST_YTD
| eval RANGE = "-1@y"
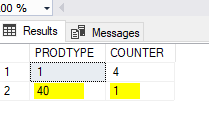
The misplacement of the counts occurs only in the WTD column, which should be the following:
for Prod Type 40 should be 1 count for Avenue1
Weekly (correct counts):
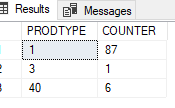
Quarter (correct counts):
But I am getting this: the 1 count that belongs in Prod Type 40 is showing in Prod 3 instead for the WTD:
All other columns MTD, QTD, and YTD numbers match fine
Note: the discrepancy in Prod Type 1 for the QTD and YTD is okay because Splunk is not up to date, it's 2 days behind.
If anyone please , can tell me what I am doing wrong. I have cloned each of the saved searches. And I made sure the DESCRIPTION are all the same across all saves searches.
Thank you,
Dyana
- Mark as New
- Bookmark Message
- Subscribe to Message
- Mute Message
- Subscribe to RSS Feed
- Permalink
- Report Inappropriate Content
This is a well-explained post, nicely done.
What's Wrong?
The issue here is that the | appendcols command does not respect any field values, it simply merges the events (rows) in the same order that the searches produce them in, read more here.
Step-by-step in context:
Say QTD_Search returns:
| DESCRIPTION | QTD |
| 1 | 87 |
| 3 | 1 |
| 40 | 6 |
Say MTD_Search returns:
| DESCRIPTION | MTD |
| 1 | 4 |
| 40 | 1 |
Then,
`QTD_Search`
| appendcols [`MTD_Search`]
Will essentially make a table like this:
| DESCRIPTION | QTD | DESCRIPTION | MTD |
| 1 | 87 | 1 | 4 |
| 3 | 1 | 40 | 1 |
| 40 | 6 |
By default, the | appendcols command's override argument is set to false so when when there is a field conflict (like DESCRIPTION) it basically gets dropped (which is masking your problem):
| DESCRIPTION | QTD | MTD |
| 1 | 87 | 4 |
| 3 | 1 | 1 |
| 40 | 6 |
The reason why YTD is working must be because its DESCRIPTION lines up with QTD's throughout all of the rows.
How do we fix it?
What you need, is something that will merge your result sets contextually based on the DESCRIPTION. To address this we can use | append to append all of the subsearch results together at the bottom of the main search (retaining their PRODTYPE DESCRIPTIONS) and then a | stats command to organise them by DESCRIPTION at the end. Your new branch search might look something like this:
| loadjob savedsearch="....:search:Retail_TEST_QTD"
| rename CREATEDATBRANCH as Branch
| lookup BranchNums Branch
| search BranchNames="Avenue1"
| stats count(TOTALCOUNT) as QTD by DESCRIPTION
| append
    [| loadjob savedsearch="....:search:Retail_TEST_YTD"
    | rename CREATEDATBRANCH as Branch
    | lookup BranchNums Branch
    | search BranchNames="Avenue1"
    | stats count(TOTALCOUNT) as YTD by DESCRIPTION]
| append
    [| loadjob savedsearch="....:search:Retail_TEST_MTD"
    | rename CREATEDATBRANCH as Branch
    | lookup BranchNums Branch
    | search BranchNames="Avenue1"
    | stats count(TOTALCOUNT) as MTD by DESCRIPTION]
| append
    [| loadjob savedsearch="....:search:Retail_TEST_WTD"
    | rename CREATEDATBRANCH as Branch
    | lookup BranchNums Branch
    | search BranchNames="Avenue1"
    | stats count(TOTALCOUNT) as WTD by DESCRIPTION]
| rename DESCRIPTION as PROD_DESCRIPTION
| fields PROD_DESCRIPTION WTD MTD QTD YTD
| stats values(*) as * by PROD_DESCRIPTION
| table PROD_DESCRIPTION WTD MTD QTD YTD
| addtotals row=f col=t labelfield=PROD_DESCRIPTION label="PROD Total:"
- Mark as New
- Bookmark Message
- Subscribe to Message
- Mute Message
- Subscribe to RSS Feed
- Permalink
- Report Inappropriate Content
It DOES work beautifully! Thank you so much! 🙂
I learned something new in Splunk today. The explanation helped a lot.
- Mark as New
- Bookmark Message
- Subscribe to Message
- Mute Message
- Subscribe to RSS Feed
- Permalink
- Report Inappropriate Content
Great news, I'm glad this helped!
Feel free to mark this as the accepted solution, if you think it should be 😊.
- Mark as New
- Bookmark Message
- Subscribe to Message
- Mute Message
- Subscribe to RSS Feed
- Permalink
- Report Inappropriate Content
This is also a very detailed, well explained post! I understand what you're saying.
Dyana
- Mark as New
- Bookmark Message
- Subscribe to Message
- Mute Message
- Subscribe to RSS Feed
- Permalink
- Report Inappropriate Content
Thank you TOM!
I will go ahead and test this now. I cannot wait to see if this will fix my problem. Thank you so much again.
Dyana


