- Splunk Answers
- :
- Using Splunk
- :
- Splunk Search
- :
- Re: What is the least resource-intensive way to pl...
- Subscribe to RSS Feed
- Mark Topic as New
- Mark Topic as Read
- Float this Topic for Current User
- Bookmark Topic
- Subscribe to Topic
- Mute Topic
- Printer Friendly Page
- Mark as New
- Bookmark Message
- Subscribe to Message
- Mute Message
- Subscribe to RSS Feed
- Permalink
- Report Inappropriate Content
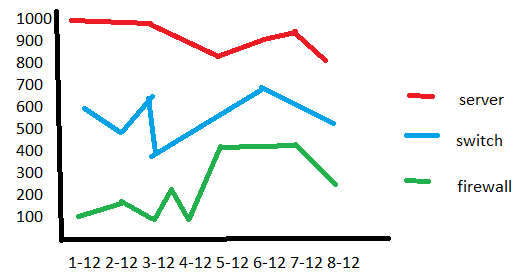
So I want to create a dashboard with each panel monitoring one index. Within a panel, it would be a timechart with count by time and each sourcetype would be represented by a separate line.
Here's a mockup of what I wanted to achieve:
I know it's pretty. Now the catch is - normal searches are gonna be very resource intensive and I'd rather have something lightweight if possible.
Any suggestions would be appreciated - I tried tstats but wasn't able to make it work in that manner.
Cheers!
- Mark as New
- Bookmark Message
- Subscribe to Message
- Mute Message
- Subscribe to RSS Feed
- Permalink
- Report Inappropriate Content
If you're just looking to plot event count by index and sourcetype, tstats would be the fastest way. Try like this
| tstats count WHERE index=YourIndex by _time sourcetype span=1d | timechart span=1d max(count) as count by sourcetype limit=0
- Mark as New
- Bookmark Message
- Subscribe to Message
- Mute Message
- Subscribe to RSS Feed
- Permalink
- Report Inappropriate Content
Thanks @somesoni2, that's exacly what I was looking for!

