Join the Conversation
- Find Answers
- :
- Using Splunk
- :
- Splunk Search
- :
- Tweaking a timechart
- Subscribe to RSS Feed
- Mark Topic as New
- Mark Topic as Read
- Float this Topic for Current User
- Bookmark Topic
- Subscribe to Topic
- Mute Topic
- Printer Friendly Page
- Mark as New
- Bookmark Message
- Subscribe to Message
- Mute Message
- Subscribe to RSS Feed
- Permalink
- Report Inappropriate Content
Hi,
I have a 20 servers that belong to cluster A (servers 1-10) and cluster B (servers 11-20).
My requirement is as follows,
TYPE OF CHART: TIMECHART
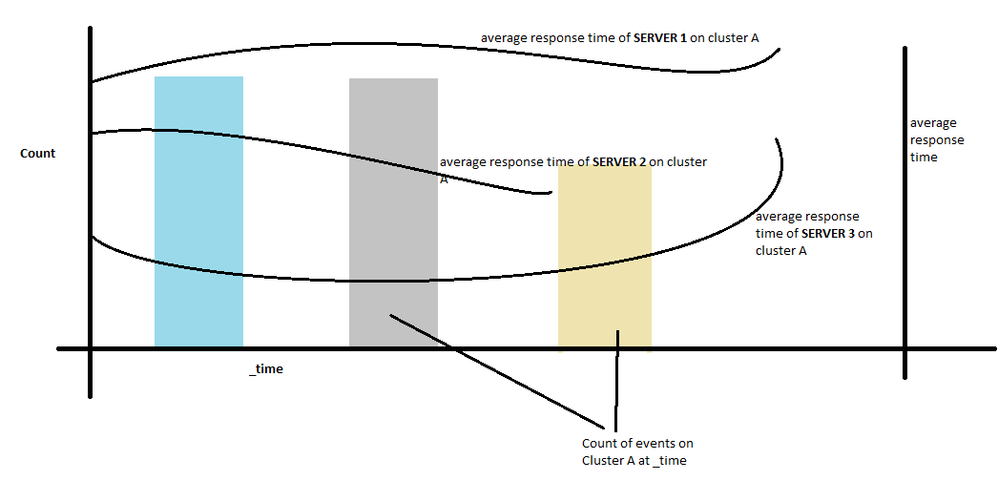
The blocks in the chart need to be by cluster.
The lines need to be by server. as given below,
I have figured out the rest of overlaying and having two Y axes.
Can anyone please help me with the query to create the blocks by cluster and the lines by server?
Thanks.
- Mark as New
- Bookmark Message
- Subscribe to Message
- Mute Message
- Subscribe to RSS Feed
- Permalink
- Report Inappropriate Content
Try this
base search | bin span=1d _time | eval blocks=_time.'#".cluster | chart avg(response_time) as rt over blocks by server | rex field=blocks "(?<_time>[^\#]+)\#(?<cluster>.*)" | fields - blocks | eventstats count(eval(cluster="A")) as cluster_A count(eval(cluster="B")) as cluster_B by _time
- Mark as New
- Bookmark Message
- Subscribe to Message
- Mute Message
- Subscribe to RSS Feed
- Permalink
- Report Inappropriate Content
Thankyou, that worked.
I have just one small thing left. When I try to overlay the response time on top of count, the options for overlay are displayed as host1, host2 .... host 10.
I do not want to select each of the servers individually as they are many in no. and are likely to increase in the future.
Can I select to the response time as a single field instead of selecting the servers individually? (Even though the response time is plotted per server)
i.e. avg(response_time) as rt over blocks by server needs to be referred as a single field instead of individual server names in Chart Overlay.
- Mark as New
- Bookmark Message
- Subscribe to Message
- Mute Message
- Subscribe to RSS Feed
- Permalink
- Report Inappropriate Content
I don't believe you an do that. You may want to consider putting the cluster as the overlay line graph and the avg response time as bar chart. For overlay, you have to select each category individually.
- Mark as New
- Bookmark Message
- Subscribe to Message
- Mute Message
- Subscribe to RSS Feed
- Permalink
- Report Inappropriate Content
Thankyou. I guess I'll have to stick to the hard way of selecting each of the servers individually.

