Turn on suggestions
Auto-suggest helps you quickly narrow down your search results by suggesting possible matches as you type.
Showing results for
Splunk Search
Turn on suggestions
Auto-suggest helps you quickly narrow down your search results by suggesting possible matches as you type.
Showing results for
- Splunk Answers
- :
- Using Splunk
- :
- Splunk Search
- :
- Table keep last event by criteria
Options
- Subscribe to RSS Feed
- Mark Topic as New
- Mark Topic as Read
- Float this Topic for Current User
- Bookmark Topic
- Subscribe to Topic
- Mute Topic
- Printer Friendly Page
- Mark as New
- Bookmark Message
- Subscribe to Message
- Mute Message
- Subscribe to RSS Feed
- Permalink
- Report Inappropriate Content
erwanlebaron
Engager
11-20-2019
09:34 AM
Hi
I've a question regarding stat or eventstat option last.
I would like to keep the last "event" in a table with several informations and I don't succeed.
index=dynatrace
| streamstats last("consumedHostUnits") by "vmwareName"
| eval FirstTime=strftime(firstSeenTimestamp/1000,"%d-%m-%Y %H:%M"), LastTime=strftime(lastSeenTimestamp/1000,"%d-%m-%Y %H:%M")
| table "vmwareName" "ipAddresses{}" "consumedHostUnits" "managementZones{}.name" monitoringMode FirstTime LastTime _time
| sort "consumedHostUnits" desc
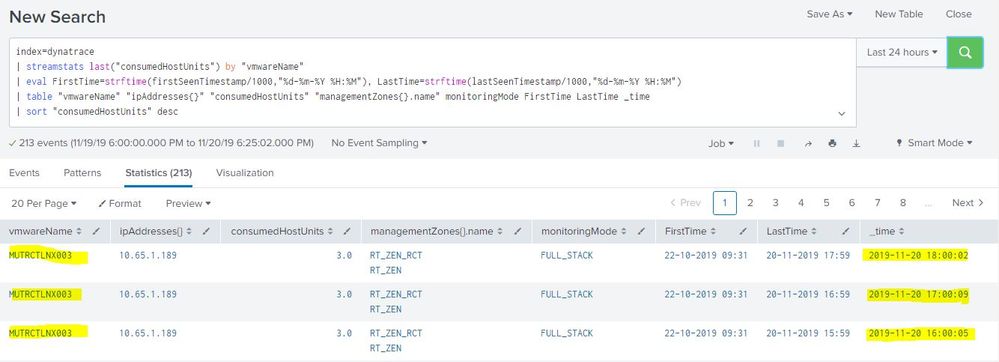
And I've 3 times a row for a server
And if I use "stats" instead of "eventstats" I lost data for the others column
index=dynatrace
| stats last("consumedHostUnits") as HU by "vmwareName"
| eval FirstTime=strftime(firstSeenTimestamp/1000,"%d-%m-%Y %H:%M"), LastTime=strftime(lastSeenTimestamp/1000,"%d-%m-%Y %H:%M")
| sort HU desc
| table "vmwareName" "ipAddresses{}" HU "managementZones{}.name" monitoringMode FirstTime LastTime _time
What is the solution to have the first screenshot with only a single line as the second screenshot ?
Regards
1 Solution
- Mark as New
- Bookmark Message
- Subscribe to Message
- Mute Message
- Subscribe to RSS Feed
- Permalink
- Report Inappropriate Content
mayurr98
Super Champion
11-20-2019
10:27 AM
try this:
index=dynatrace
| stats last("consumedHostUnits") as HU values(firstSeenTimestamp) as firstSeenTimestamp values(lastSeenTimestamp) as lastSeenTimestamp values("ipAddresses{}") as "ipAddresses{}" values("managementZones{}.name") as "managementZones{}.name" values(monitoringMode) as monitoringMode values(_time) as time by "vmwareName"
| eval FirstTime=strftime(firstSeenTimestamp/1000,"%d-%m-%Y %H:%M"), LastTime=strftime(lastSeenTimestamp/1000,"%d-%m-%Y %H:%M")
| convert ctime(time) as time
| sort HU desc
| table "vmwareName" "ipAddresses{}" HU "managementZones{}.name" monitoringMode FirstTime LastTime time
- Mark as New
- Bookmark Message
- Subscribe to Message
- Mute Message
- Subscribe to RSS Feed
- Permalink
- Report Inappropriate Content
erwanlebaron
Engager
11-21-2019
12:17 AM
I was exactly what I was looking for.
I hadn't understood the "values" while using stats.
Thanks a lot
- Mark as New
- Bookmark Message
- Subscribe to Message
- Mute Message
- Subscribe to RSS Feed
- Permalink
- Report Inappropriate Content
mayurr98
Super Champion
11-20-2019
10:27 AM
try this:
index=dynatrace
| stats last("consumedHostUnits") as HU values(firstSeenTimestamp) as firstSeenTimestamp values(lastSeenTimestamp) as lastSeenTimestamp values("ipAddresses{}") as "ipAddresses{}" values("managementZones{}.name") as "managementZones{}.name" values(monitoringMode) as monitoringMode values(_time) as time by "vmwareName"
| eval FirstTime=strftime(firstSeenTimestamp/1000,"%d-%m-%Y %H:%M"), LastTime=strftime(lastSeenTimestamp/1000,"%d-%m-%Y %H:%M")
| convert ctime(time) as time
| sort HU desc
| table "vmwareName" "ipAddresses{}" HU "managementZones{}.name" monitoringMode FirstTime LastTime time
Get Updates on the Splunk Community!
.conf24 | Registration Open!
Hello, hello! I come bearing good news: Registration for .conf24 is now open!
conf is Splunk’s rad annual ...
ICYMI - Check out the latest releases of Splunk Edge Processor
Splunk is pleased to announce the latest enhancements to Splunk Edge Processor.
HEC Receiver authorization ...
Introducing the 2024 SplunkTrust!
Hello, Splunk Community! We are beyond thrilled to announce our newest group of SplunkTrust members!
The ...


