- Splunk Answers
- :
- Using Splunk
- :
- Splunk Search
- :
- Table format raw data
- Subscribe to RSS Feed
- Mark Topic as New
- Mark Topic as Read
- Float this Topic for Current User
- Bookmark Topic
- Subscribe to Topic
- Mute Topic
- Printer Friendly Page
- Mark as New
- Bookmark Message
- Subscribe to Message
- Mute Message
- Subscribe to RSS Feed
- Permalink
- Report Inappropriate Content
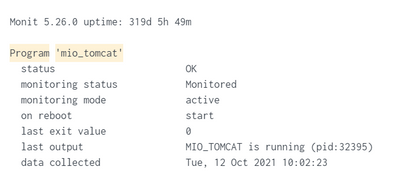
I want to extract the field that are on the left which are status, monitoirng status, monitoring mode and so on. Multikv command can be used when the header is at the first row. What command should I use in Splunk search if the header is at the first column?
- Mark as New
- Bookmark Message
- Subscribe to Message
- Mute Message
- Subscribe to RSS Feed
- Permalink
- Report Inappropriate Content
Convert each event to the equivalent JSON string and then use spath to extract the fields
| makeresults
| eval _raw="Monit 5.26.0 uptime: 320d 5h 28m

Program 'mio_tomcat'
  status                       OK
  monitoring status            Monitored
  monitoring mode              active
  on reboot                    start
  last exit value              0
  last output                  MIO_TOMCAT is running (pid:3994)
  data collected               Tue, 12 Oct 2021 10:02:30
|
Monit 5.26.0 uptime: 320d 5h 28m

Program 'mio_tomcat'
  status                       OK
  monitoring status            Monitored
  monitoring mode              active
  on reboot                    start
  last exit value              0
  last output                  MIO_TOMCAT is running (pid:2486)
  data collected               Tue, 12 Oct 2021 10:02:22"
| eval event=split(_raw,"|")
| mvexpand event
| eval _raw=event
| table _raw


| rex max_match=0 "\s\s(?<name>.{30})(?<value>.*)"
| eval name=mvmap(name,"\"".trim(name)."\"")
| eval value=mvmap(value,"\"".value."\"")
| eval fields=mvzip(name,value,":")
| eval _raw="{".mvjoin(fields,",")."}"
| table _raw
| spath- Mark as New
- Bookmark Message
- Subscribe to Message
- Mute Message
- Subscribe to RSS Feed
- Permalink
- Report Inappropriate Content
Yes it represents one event in Splunk.
The raw data
Monit 5.26.0 uptime: 320d 5h 28m

Program 'mio_tomcat'
  status                       OK
  monitoring status            Monitored
  monitoring mode              active
  on reboot                    start
  last exit value              0
  last output                  MIO_TOMCAT is running (pid:3994)
  data collected               Tue, 12 Oct 2021 10:02:30

Monit 5.26.0 uptime: 320d 5h 28m

Program 'mio_tomcat'
  status                       OK
  monitoring status            Monitored
  monitoring mode              active
  on reboot                    start
  last exit value              0
  last output                  MIO_TOMCAT is running (pid:2486)
  data collected               Tue, 12 Oct 2021 10:02:22
The spacing is the same for all events. The columns do line up for all events.
- Mark as New
- Bookmark Message
- Subscribe to Message
- Mute Message
- Subscribe to RSS Feed
- Permalink
- Report Inappropriate Content
Convert each event to the equivalent JSON string and then use spath to extract the fields
| makeresults
| eval _raw="Monit 5.26.0 uptime: 320d 5h 28m

Program 'mio_tomcat'
  status                       OK
  monitoring status            Monitored
  monitoring mode              active
  on reboot                    start
  last exit value              0
  last output                  MIO_TOMCAT is running (pid:3994)
  data collected               Tue, 12 Oct 2021 10:02:30
|
Monit 5.26.0 uptime: 320d 5h 28m

Program 'mio_tomcat'
  status                       OK
  monitoring status            Monitored
  monitoring mode              active
  on reboot                    start
  last exit value              0
  last output                  MIO_TOMCAT is running (pid:2486)
  data collected               Tue, 12 Oct 2021 10:02:22"
| eval event=split(_raw,"|")
| mvexpand event
| eval _raw=event
| table _raw


| rex max_match=0 "\s\s(?<name>.{30})(?<value>.*)"
| eval name=mvmap(name,"\"".trim(name)."\"")
| eval value=mvmap(value,"\"".value."\"")
| eval fields=mvzip(name,value,":")
| eval _raw="{".mvjoin(fields,",")."}"
| table _raw
| spath- Mark as New
- Bookmark Message
- Subscribe to Message
- Mute Message
- Subscribe to RSS Feed
- Permalink
- Report Inappropriate Content
Does this represent one event in splunk?
Can you share some raw event examples in a code block </>?
Is the spacing the same in all the events e.g. do all the columns line up in all the events?

