Turn on suggestions
Auto-suggest helps you quickly narrow down your search results by suggesting possible matches as you type.
Splunk Search
×
Join the Conversation
Without signing in, you're just watching from the sidelines. Sign in or Register to connect, share, and be part of the Splunk Community.
Turn on suggestions
Auto-suggest helps you quickly narrow down your search results by suggesting possible matches as you type.
- Find Answers
- :
- Using Splunk
- :
- Splunk Search
- :
- Sparkline column - correct but shrinked VS wrong b...
Options
- Subscribe to RSS Feed
- Mark Topic as New
- Mark Topic as Read
- Float this Topic for Current User
- Bookmark Topic
- Subscribe to Topic
- Mute Topic
- Printer Friendly Page
- Mark as New
- Bookmark Message
- Subscribe to Message
- Mute Message
- Subscribe to RSS Feed
- Permalink
- Report Inappropriate Content
Sparkline column - correct but shrinked VS wrong but stretched
altink
Builder
12-14-2020
09:58 AM
Hello
In the search as below:
index=_audit action=alert_fired ss_app=app_name
| eval alert_severity = case (severity==1,"Information",severity==2,"Low", severity==3,"Medium",severity==4,"High",severity==5,"Critical")
| fields _time ss_name severity trigger_time alert_severity
| stats earliest(trigger_time) as min_time, latest(trigger_time) as max_time, sparkline(count) as Spark_line, count by ss_name alert_severity
| eval min_time = strftime(min_time, "%Y-%m-%d %H:%M:%S")
| eval max_time = strftime(max_time, "%Y-%m-%d %H:%M:%S")
| table ss_name, min_time, max_time count alert_severity
| rename ss_name as "Alert Name" min_time as "Start Time" max_time as "End Time" count as "Number of Alerts" alert_severity as "Criticality"
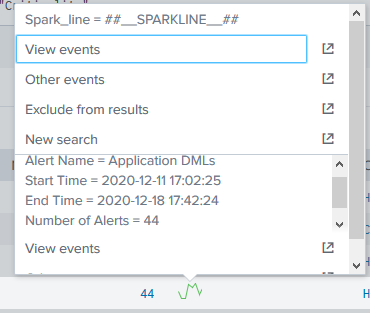
The Sparkline produced is correct in count (image001.png) and presentation. But it is shkrinked to a very small size and does not look good.
So I try to change from:
sparkline(count,30m) as Spark_line -> sparkline(count,30m) as Spark_line
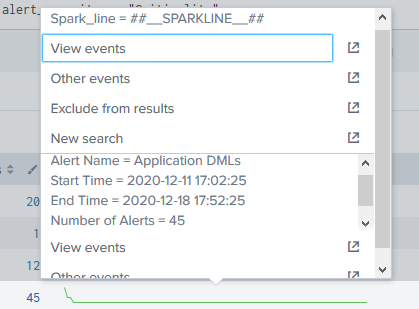
This time the layout is much better, the result is OK (image002.png), but the Graphic Presantation (points) are wrong.
How can I have the right graphical presentation by keeping sparkline wide enough?
image 001
image 002
best regard
Altin
- Mark as New
- Bookmark Message
- Subscribe to Message
- Mute Message
- Subscribe to RSS Feed
- Permalink
- Report Inappropriate Content
altink
Builder
01-20-2021
06:30 AM
Hi
Is there anyone that can advise?
regards
Altin
Get Updates on the Splunk Community!
Your Guide to Splunk Digital Experience Monitoring
A flawless digital experience isn't just an advantage, it's key to customer loyalty and business success. But ...
Data Management Digest – November 2025
Welcome to the inaugural edition of Data Management Digest!
As your trusted partner in data innovation, the ...
Upcoming Webinar: Unmasking Insider Threats with Slunk Enterprise Security’s UEBA
Join us on Wed, Dec 10. at 10AM PST / 1PM EST for a live webinar and demo with Splunk experts! Discover how ...


