Turn on suggestions
Auto-suggest helps you quickly narrow down your search results by suggesting possible matches as you type.
Showing results for
Splunk Search
Turn on suggestions
Auto-suggest helps you quickly narrow down your search results by suggesting possible matches as you type.
Showing results for
- Splunk Answers
- :
- Using Splunk
- :
- Splunk Search
- :
- Re: Sparkline column - correct but shrinked VS wro...
Options
- Subscribe to RSS Feed
- Mark Topic as New
- Mark Topic as Read
- Float this Topic for Current User
- Bookmark Topic
- Subscribe to Topic
- Mute Topic
- Printer Friendly Page
- Mark as New
- Bookmark Message
- Subscribe to Message
- Mute Message
- Subscribe to RSS Feed
- Permalink
- Report Inappropriate Content
Sparkline column - correct but shrinked VS wrong but stretched
altink
Builder
12-14-2020
09:58 AM
Hello
In the search as below:
index=_audit action=alert_fired ss_app=app_name
| eval alert_severity = case (severity==1,"Information",severity==2,"Low", severity==3,"Medium",severity==4,"High",severity==5,"Critical")
| fields _time ss_name severity trigger_time alert_severity
| stats earliest(trigger_time) as min_time, latest(trigger_time) as max_time, sparkline(count) as Spark_line, count by ss_name alert_severity
| eval min_time = strftime(min_time, "%Y-%m-%d %H:%M:%S")
| eval max_time = strftime(max_time, "%Y-%m-%d %H:%M:%S")
| table ss_name, min_time, max_time count alert_severity
| rename ss_name as "Alert Name" min_time as "Start Time" max_time as "End Time" count as "Number of Alerts" alert_severity as "Criticality"
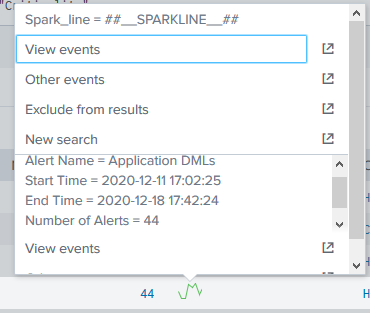
The Sparkline produced is correct in count (image001.png) and presentation. But it is shkrinked to a very small size and does not look good.
So I try to change from:
sparkline(count,30m) as Spark_line -> sparkline(count,30m) as Spark_line
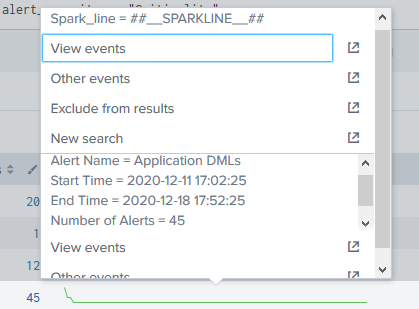
This time the layout is much better, the result is OK (image002.png), but the Graphic Presantation (points) are wrong.
How can I have the right graphical presentation by keeping sparkline wide enough?
image 001
image 002
best regard
Altin
- Mark as New
- Bookmark Message
- Subscribe to Message
- Mute Message
- Subscribe to RSS Feed
- Permalink
- Report Inappropriate Content
altink
Builder
01-20-2021
06:30 AM
Hi
Is there anyone that can advise?
regards
Altin
Get Updates on the Splunk Community!
Introducing Splunk Enterprise 9.2
WATCH HERE! Watch this Tech Talk to learn about the latest features and enhancements shipped in the new Splunk ...
Adoption of RUM and APM at Splunk
Unleash the power of Splunk Observability
Watch Now
In this can't miss Tech Talk! The Splunk Growth ...
Routing logs with Splunk OTel Collector for Kubernetes
The Splunk Distribution of the OpenTelemetry (OTel) Collector is a product that provides a way to ingest ...


