- Splunk Answers
- :
- Using Splunk
- :
- Splunk Search
- :
- Show all events for individual users during a time...
- Subscribe to RSS Feed
- Mark Topic as New
- Mark Topic as Read
- Float this Topic for Current User
- Bookmark Topic
- Subscribe to Topic
- Mute Topic
- Printer Friendly Page
- Mark as New
- Bookmark Message
- Subscribe to Message
- Mute Message
- Subscribe to RSS Feed
- Permalink
- Report Inappropriate Content
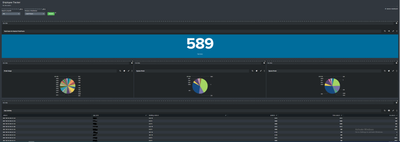
Creating a dashboard to track when users badge into and out of different areas.
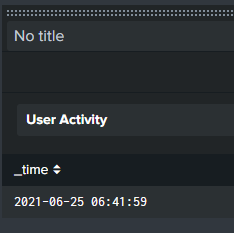
Problem: If I do a basic search for a user_id, I get back multiple listings for that user with different timestamps for each badge use, great. I created a dashboard that allows me to : search all/specific user(s) by ID and allot what timeframe to search in. On the dashboard at the bottom for "user activity", it will only display1 event per user_id listed in that timeframe (or just 1 event for a specific user when searched), even if a user badged in multiple times.
Request: How can I make it so all instances of a badge being used are shown? I would prefer to be able to do a dropdown window type of setup when all events for a user show up under their ID, but I can live with all instances during that timeframe being shown in series.
-=-=-=-=-=-=-=-=-=-=-=-=-=-=-=-=-=-=-=-=-=-=-=-=-=-=
Source:
<form theme="dark" refresh="300">
<label>Employee Tracker</label>
<search id="base_search">
<query>index="argus" argus_passage | table _time, user_id, building_name, portal,from_area, to_area</query>
<earliest>$time_token.earliest$</earliest>
<latest>$time_token.latest$</latest>
</search>
<fieldset submitButton="true" autoRun="true">
<input type="dropdown" token="user_id" searchWhenChanged="false">
<label>Search a UserID:</label>
<choice value="*">All</choice>
<search base="base_search">
<query>| stats count by user_id</query>
</search>
<fieldForLabel>user_id</fieldForLabel>
<fieldForValue>user_id</fieldForValue>
<default>*</default>
<initialValue>*</initialValue>
</input>
<input type="time" token="time_token" searchWhenChanged="false">
<label>Choose a TimeFrame:</label>
<default>
<earliest>-24h@h</earliest>
<latest>now</latest>
</default>
</input>
</fieldset>
<row>
<panel>
<single>
<title>Total Users for Desired TimeFrame</title>
<search base="base_search">
<query>| dedup user_id | stats count</query>
</search>
<option name="colorMode">block</option>
<option name="drilldown">none</option>
<option name="height">251</option>
<option name="rangeColors">["0x53a051","0x0877a6","0xf8be34","0xf1813f","0x006d9c"]</option>
<option name="underLabel">Total Users</option>
<option name="useColors">1</option>
</single>
</panel>
</row>
<row>
<panel>
<chart>
<title>Portal Usage</title>
<search base="base_search">
<query>| search user_id=$user_id$ | dedup user_id | stats count by portal</query>
</search>
<option name="charting.chart">pie</option>
<option name="charting.drilldown">none</option>
</chart>
</panel>
<panel>
<chart>
<title>Ingress Portal</title>
<search base="base_search">
<query>| search user_id=$user_id$ | dedup user_id | stats count by from_area</query>
</search>
<option name="charting.chart">pie</option>
<option name="charting.drilldown">none</option>
</chart>
</panel>
<panel>
<chart>
<title>Egress Portal</title>
<search base="base_search">
<query>| search user_id=$user_id$ | dedup user_id | stats count by to_area</query>
</search>
<option name="charting.chart">pie</option>
<option name="charting.drilldown">none</option>
</chart>
</panel>
</row>
<row>
<panel>
<table>
<title>User Activity</title>
<search base="base_search">
<query>| search user_id=$user_id$ | dedup user_id | sort -count</query>
</search>
<option name="count">50</option>
<option name="drilldown">none</option>
</table>
</panel>
</row>
</form>
- Mark as New
- Bookmark Message
- Subscribe to Message
- Mute Message
- Subscribe to RSS Feed
- Permalink
- Report Inappropriate Content
your last search for user activity is doing this
_Base_Search_
index="argus" argus_passage | table _time, user_id, building_name, portal,from_area, to_area

_Subsequent_Search_
| search user_id=$user_id$ | dedup user_id | sort -count
So you are reducing all events for that user to a single event. Also, there is no 'count' field, so the sort is meaningless.
If you want all events for that user, just remove the | dedup user_id | sort -count
Note also that base searches should really be a transforming search and if not, you need to specify the fields you want - see https://docs.splunk.com/Documentation/Splunk/8.2.0/Viz/Savedsearches#Post-process_searches_2
You are using the table command - you should make that a fields command (and also table if you want the formatting). fields command is more efficient and will ensure that the data is removed at the indexer rather than the table command, where data is removed at the search head.
- Mark as New
- Bookmark Message
- Subscribe to Message
- Mute Message
- Subscribe to RSS Feed
- Permalink
- Report Inappropriate Content
I was able to achieve the desired effect by removing the "dedup user_id" and replacing with "uniq".
I will try your suggestion and see how that works as well.


