- Splunk Answers
- :
- Using Splunk
- :
- Splunk Search
- :
- Re: Plotting instances of logs onto chart
- Subscribe to RSS Feed
- Mark Topic as New
- Mark Topic as Read
- Float this Topic for Current User
- Bookmark Topic
- Subscribe to Topic
- Mute Topic
- Printer Friendly Page
- Mark as New
- Bookmark Message
- Subscribe to Message
- Mute Message
- Subscribe to RSS Feed
- Permalink
- Report Inappropriate Content
Hi
My log looks like this:
2013-10-07T15:37:27.334Z | allepha | 2013-10-07T16:37:04+01:00 info platform shell AppExplorer started in: 140ms
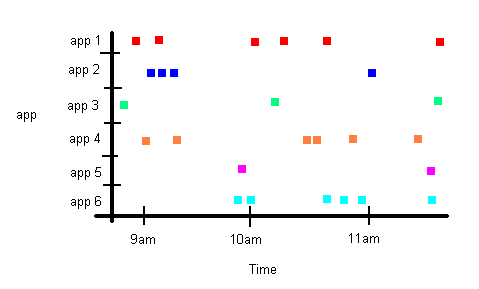
The thing I am interested in within the log is the App, which in this case is called "AppExplorer". Other than that I am only interested that this log was created at the time it states at the start.
I want to plot a chart like below. Each dot on the chart represents that a log was created at that time. So you can see from the chart below that 2 logs were created at around 9am for "app 1" (i.e. the 2 red squares).
How do I go about writing the search query for this in Splunk?
Thanks
Phil
- Mark as New
- Bookmark Message
- Subscribe to Message
- Mute Message
- Subscribe to RSS Feed
- Permalink
- Report Inappropriate Content
You could try: your_search | rex field=_raw "shell\s*(?<AppName>[^\s]*)"| eval Present = 1 | timechart span=5m max(Present) by AppName, and then in your visualization parameters, make it a Column Chart and change the "Multi Series Mode" to "split".
- Mark as New
- Bookmark Message
- Subscribe to Message
- Mute Message
- Subscribe to RSS Feed
- Permalink
- Report Inappropriate Content
That's perfect. Thanks a lot for your help.
Announcing Scheduled Export GA for Dashboard Studio
Extending Observability Content to Splunk Cloud
More Control Over Your Monitoring Costs with Archived Metrics GA in US-AWS!
