- Splunk Answers
- :
- Using Splunk
- :
- Splunk Search
- :
- Re: Need your help to create the dashboard for the...
- Subscribe to RSS Feed
- Mark Topic as New
- Mark Topic as Read
- Float this Topic for Current User
- Bookmark Topic
- Subscribe to Topic
- Mute Topic
- Printer Friendly Page
- Mark as New
- Bookmark Message
- Subscribe to Message
- Mute Message
- Subscribe to RSS Feed
- Permalink
- Report Inappropriate Content
Hi community,
Good Day...!
Need your help to create dashboard for all the notables which are all in the in-progress and pending status along with the assignee names. I was using the below quire but couldn't able to get the correct details please help me out the correct one.
| `es_notable_events` | search timeDiff_type=current | stats sum(count) as count by urgency | `stats2chart("urgency")`
Thanks in Advance,
Kishore.
- Mark as New
- Bookmark Message
- Subscribe to Message
- Mute Message
- Subscribe to RSS Feed
- Permalink
- Report Inappropriate Content
Hi @mputtam,
I have created a query based on the `es_notable_events`, following your initial idea.
| `es_notable_events`
| search timeDiff_type=current AND (status=2 OR status=3)
| table _time, owner, status, status_group, event_id, rule_title
I guess that the query above is a good start and can help you out. In my case, status 2 and 3 are "In Progress" and "Pending".
- Mark as New
- Bookmark Message
- Subscribe to Message
- Mute Message
- Subscribe to RSS Feed
- Permalink
- Report Inappropriate Content
Hi alonsocaio,
Thank you very much for your help to getting this issue resolved.
Regards,
Kishore
- Mark as New
- Bookmark Message
- Subscribe to Message
- Mute Message
- Subscribe to RSS Feed
- Permalink
- Report Inappropriate Content
Hi @mputtam,
I have created a query based on the `es_notable_events`, following your initial idea.
| `es_notable_events`
| search timeDiff_type=current AND (status=2 OR status=3)
| table _time, owner, status, status_group, event_id, rule_title
I guess that the query above is a good start and can help you out. In my case, status 2 and 3 are "In Progress" and "Pending".
- Mark as New
- Bookmark Message
- Subscribe to Message
- Mute Message
- Subscribe to RSS Feed
- Permalink
- Report Inappropriate Content
Hi alonsocaio,
Thanks for prompting on this...!
I have checked the query which you had given for the past 24 hours. but there was a difference in the notable count which was presence in the incident review and the query results. and also need all the status names in the results not with the numeric's.
Tell me if any other ways as well...
| `es_notable_events` | search timeDiff_type=current AND (status=2 OR status=3) | table _time, owner, status, status_group, event_id, rule_title
- Mark as New
- Bookmark Message
- Subscribe to Message
- Mute Message
- Subscribe to RSS Feed
- Permalink
- Report Inappropriate Content
I have made some changes to the query, maybe this new one can help you.
`notable`
| search status=2 OR status=3
| join event_id
    [| inputlookup es_notable_events
    | table event_id, rule_title ]
| table _time, event_id, rule_title, status_label, owner, comment
- Mark as New
- Bookmark Message
- Subscribe to Message
- Mute Message
- Subscribe to RSS Feed
- Permalink
- Report Inappropriate Content
Hi alonsocaio,
Thanks you very much to getting this resolved🙂.
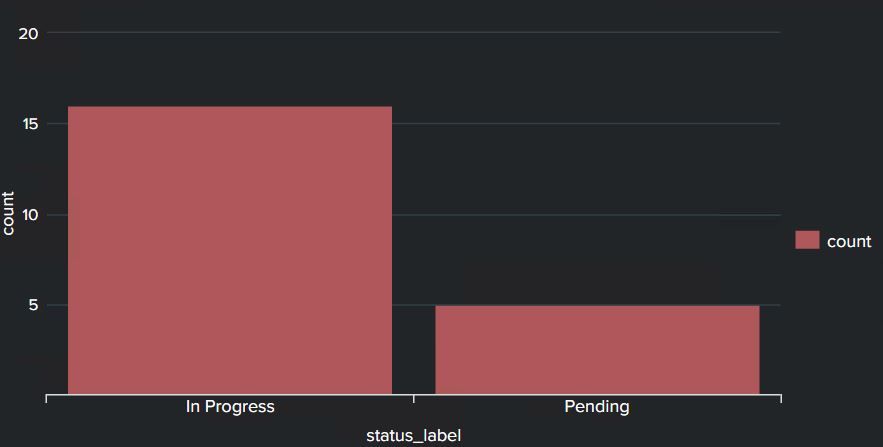
I want to change the colors for the bar chart could you please help me on this..? as it was taking default colors there is no option in UI to select the other colors. Please help me out on this.
Have a look into the attached file for your reference.
Thanks in advance,
Kishore.
- Mark as New
- Bookmark Message
- Subscribe to Message
- Mute Message
- Subscribe to RSS Feed
- Permalink
- Report Inappropriate Content
Hi,
You can try adding "charting.seriesColors" option into your chart.
<option name="charting.seriesColors">[0x6232a8,0xa8325b,0x329ea8]</option>Into the series your syntax should be something like 0xCOLOR_HEX_CODE.
Your dashboard XML should look like:
<dashboard>
  <label>My Dashboard</label>
  <row>
    <panel>
      <chart>
        <title>My Chart</title>
        <search>
          <query>index=MY_INDEX | top 3 host</query>
          <earliest>-15m</earliest>
          <latest>now</latest>
        </search>
        <option name="charting.chart">column</option>
        <option name="charting.drilldown">none</option>
        <option name="refresh.display">progressbar</option>
        <option name="charting.seriesColors">[0x6232a8,0xa8325b,0x329ea8]</option>
      </chart>
    </panel>
  </row>
</dashboard>