- Splunk Answers
- :
- Using Splunk
- :
- Splunk Search
- :
- Is there a way to auto adjust the Y-value to just ...
- Subscribe to RSS Feed
- Mark Topic as New
- Mark Topic as Read
- Float this Topic for Current User
- Bookmark Topic
- Subscribe to Topic
- Mute Topic
- Printer Friendly Page
- Mark as New
- Bookmark Message
- Subscribe to Message
- Mute Message
- Subscribe to RSS Feed
- Permalink
- Report Inappropriate Content
Is there a way to auto adjust the Y-value to just show the significant part of the chart?

- Mark as New
- Bookmark Message
- Subscribe to Message
- Mute Message
- Subscribe to RSS Feed
- Permalink
- Report Inappropriate Content
@daniel333 There could be several ways of highlighting interesting data points on y-axis.
1) Chart Overlay with static threshold: Perhaps the easiest would be to come up with static threshold like in your case pipe the following after your final timechart command | eval Threshold=150000. Then Format the Chart using UI and Select Chart Overlay option. Choose the Overlay field as Threshold
Check out Splunk's Daily License Usage graph for an example on this.
2) Chart Overlay with Statistical outliers: Calculate the statistical outlier like upper and lower Standard Deviation for entire data being plotted. Then create Overlay field/s for your chart so that the area of your series which fall above or below the series will depict outliers. You might need to use eventstats, streamstats or other means to calculate overall statistical outlier, then plot the actual data in the chart.
3) Predict command: You can pipe predict command to your timechart to get a predicted series overlaid on top of your actual series
| predict count future_timespan=0
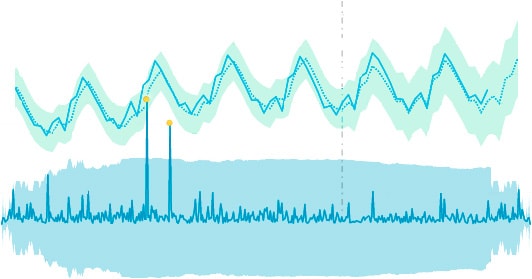
4) Machine Learning Toolkit : Splunk's Machine Learning Toolkit app is a collection of numerous industry scenarios for outlier, anomaly detection and prediction through several standard algorithms. It also come with many visualizations to plot outliers to gain attention. Do check out the app which comes with examples : https://splunkbase.splunk.com/app/2890/#/overview and documentation https://docs.splunk.com/Documentation/MLApp/latest/User/Customvisualizations
Couple of visualizations from Machine Learning Toolkit:

| makeresults | eval message= "Happy Splunking!!!"
- Mark as New
- Bookmark Message
- Subscribe to Message
- Mute Message
- Subscribe to RSS Feed
- Permalink
- Report Inappropriate Content
can you share the search for this panel?
Routing logs with Splunk OTel Collector for Kubernetes
Welcome to the Splunk Community!
Tech Talk | Elevating Digital Service Excellence: The Synergy of Splunk RUM & APM
