- Splunk Answers
- :
- Using Splunk
- :
- Splunk Search
- :
- Re: How to use stack mode on a bar chart
- Subscribe to RSS Feed
- Mark Topic as New
- Mark Topic as Read
- Float this Topic for Current User
- Bookmark Topic
- Subscribe to Topic
- Mute Topic
- Printer Friendly Page
- Mark as New
- Bookmark Message
- Subscribe to Message
- Mute Message
- Subscribe to RSS Feed
- Permalink
- Report Inappropriate Content
How to use stack mode on a bar chart
I have many Json that contains multiple fields such as:
{"FACTS Access":"True",
"FACTS Database Access":"True",
"Uniformance Oracle Access":"True",
"FACTS Lan Folder Access":"False",
"Uniformance Access":"True"}
Each of these fields support "TRUE"/"FALSE"/"MISSING" values.
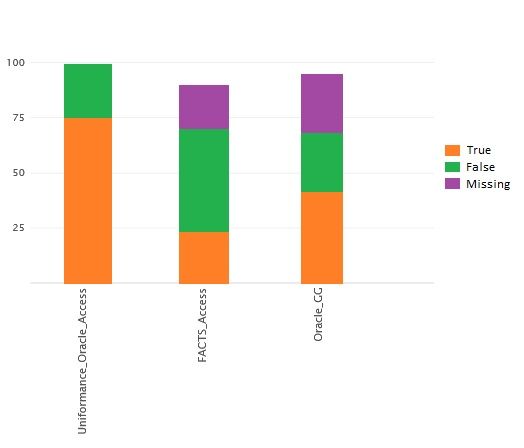
What I need to do is create a dashboard as the one displayed above where the X axis is composed by Json fields and the Y axis is the count of each of the results these fields support.
- Mark as New
- Bookmark Message
- Subscribe to Message
- Mute Message
- Subscribe to RSS Feed
- Permalink
- Report Inappropriate Content
Try like this (select column chart with Stack Mode as 'stacked')
index=foo sourcetype=bar | table _raw | spath | fields - _raw | eval temp=1
| untable temp Metrics Value | chart count by Metrics Value
- Mark as New
- Bookmark Message
- Subscribe to Message
- Mute Message
- Subscribe to RSS Feed
- Permalink
- Report Inappropriate Content
I need each of the fields to be a column in the chart:
index=msahc | rex "(?{[^}]+})" | mvexpand json_field | spath input=json_field | search ACT | eval DateTime=_time | convert timeformat="%x" ctime(DateTime) | bucket DateTime span=1d | rename "Uniformance Oracle Access" as "Uniformance_Oracle_Access", "Uniformance Access" as "Uniformance_Access", "FACTS Access" as "FACTS_Access", "Oracle GG" as "Oracle_GG", "IDM Access" as "IDM_Access", "FACTS Database Access" as "FACTS_Database_Access", "FACTS Lan Folder Access" as "FACTS_Lan_Folder_Access" | table ServerName, Uniformance_Oracle_Access, Uniformance_Access, FACTS_Access, Oracle_GG, IDM_Access, FACTS_Database_Access, FACTS_Lan_Folder_Access
- Mark as New
- Bookmark Message
- Subscribe to Message
- Mute Message
- Subscribe to RSS Feed
- Permalink
- Report Inappropriate Content
Just add this to your current search.
your current search  | eval temp=1
 | untable temp Metrics Value | chart count by Metrics Value
- Mark as New
- Bookmark Message
- Subscribe to Message
- Mute Message
- Subscribe to RSS Feed
- Permalink
- Report Inappropriate Content
The stack mode is not the problem... The main problem is how to display Json fields in the X axis, the count of each of them in the Y axis (how many "FACTS Access" are true, for example) and the colors should be the values of each of them.

