- Splunk Answers
- :
- Using Splunk
- :
- Splunk Search
- :
- How to make single visualization switches to table...
- Subscribe to RSS Feed
- Mark Topic as New
- Mark Topic as Read
- Float this Topic for Current User
- Bookmark Topic
- Subscribe to Topic
- Mute Topic
- Printer Friendly Page
- Mark as New
- Bookmark Message
- Subscribe to Message
- Mute Message
- Subscribe to RSS Feed
- Permalink
- Report Inappropriate Content
I have a query that outputs a table with services and their failure rates. I want it to be a green box that says "No Failing Services" if there are no services that are failing; but if there are, have a red box that lists all the failing services. I'm a bit new to Splunk and don't know to change visualizations/design too well.
- Mark as New
- Bookmark Message
- Subscribe to Message
- Mute Message
- Subscribe to RSS Feed
- Permalink
- Report Inappropriate Content
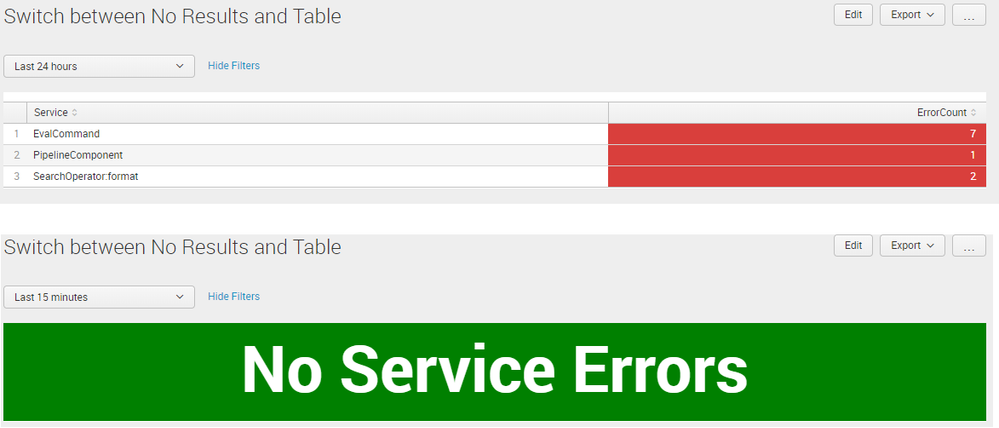
@mauricio2354, please try the following run anywhere dashboard based on Splunk's _internal index which displays a table with Failure Rate Column as Red and otherwise a single value with Green background color overridden through CSS and static No Failure message.
<form>
  <label>Switch between No Results and Table</label>
  <fieldset submitButton="false">
    <input type="time" token="tokTime" searchWhenChanged="true">
      <label></label>
      <default>
        <earliest>-5m</earliest>
        <latest>now</latest>
      </default>
    </input>
  </fieldset>
  <row>
    <panel>
      <table depends="$sohwTable$">
        <search>
          <query>index=_internal sourcetype=splunkd log_level="ERROR"
| stats count as ErrorCount by component
| rename component as Service</query>
          <earliest>$tokTime.earliest$</earliest>
          <latest>$tokTime.latest$</latest>
          <sampleRatio>1</sampleRatio>
          <done>
            <condition match="$job.resultCount$==0">
              <unset token="sohwTable"></unset>
            </condition>
            <condition>
              <set token="sohwTable">true</set>
            </condition>
          </done>
        </search>
        <option name="count">20</option>
        <option name="dataOverlayMode">none</option>
        <option name="drilldown">none</option>
        <option name="percentagesRow">false</option>
        <option name="refresh.display">progressbar</option>
        <option name="rowNumbers">true</option>
        <option name="totalsRow">false</option>
        <option name="wrap">true</option>
        <format type="color" field="ErrorCount">
          <colorPalette type="list">[#D93F3C]</colorPalette>
          <scale type="threshold"></scale>
        </format>
      </table>
      <single id="singleOkMessage" rejects="$sohwTable$">
        <search>
          <query>| makeresults
            | fields - _time
            | eval Message=0
            | rangemap field=Message green=0-0 default=green
            | replace "0" with "No Service Errors" in Message
          </query>
          <earliest>$tokTime.earliest$</earliest>
          <latest>$tokTime.latest$</latest>
        </search>
        <option name="colorMode">block</option>
        <option name="rangeColors">["0x65a637","0x65a637"]</option>
        <option name="rangeValues">[0]</option>
        <option name="useColors">1</option>
      </single>
      <!-- HTML panel for applying Green Background color for Single Value panel with id="singleOkMessage" and always hidden -->
      <html depends="$alwaysHideCSSStyle$">
        <style>
          #singleOkMessage .block-background{
            fill: green !important;
          }
        </style>
      </html>
    </panel>
  </row>
</form>
@lycollicott, since the use case is for Service Failures. No Failures is green Single Value and Failure is Red Table. Second the search query which sets the token to Green or Red based on result count can actually be placed inside the Red table.
| makeresults | eval message= "Happy Splunking!!!"
- Mark as New
- Bookmark Message
- Subscribe to Message
- Mute Message
- Subscribe to RSS Feed
- Permalink
- Report Inappropriate Content
Thanks for this amazing answer niketnilay! I was able to use this to incorporate our own query
- Mark as New
- Bookmark Message
- Subscribe to Message
- Mute Message
- Subscribe to RSS Feed
- Permalink
- Report Inappropriate Content
I was only addressing how to control the panela, not the visualizations.
- Mark as New
- Bookmark Message
- Subscribe to Message
- Mute Message
- Subscribe to RSS Feed
- Permalink
- Report Inappropriate Content
Are you putting this in a dashboard? I assume you are, so here is how I would tackle that.
I would create 2 dashboard panels with a depends attribute. I will try to get you an example today.
UPDATE: An example 🙂
Here is the code in text format to copy and paste.
<dashboard>
  <label>Depends Test</label>
  <search>
    <query>index=_internal log_level=error earliest=-60m </query>
    <done>
      <condition match=" 'job.resultCount' == 0">
        <set token="display_green">true</set>
      </condition>
      <condition>
        <unset token="display_green"></unset>
      </condition>
    </done>
  </search>
  <row>
    <panel depends="$display_green$">
      <title>Green Panel</title>
      <single>
        <search>
          <query>index=_internal log_level=error earliest=-60m | stats count</query>
        </search>
      </single>
    </panel>
    <panel rejects="$display_green$">
      <title>Red Panel</title>
      <table>
        <search>
          <query>index=_internal log_level=error earliest=-60m</query>
        </search>
      </table>
    </panel>
  </row>
</dashboard>
- Mark as New
- Bookmark Message
- Subscribe to Message
- Mute Message
- Subscribe to RSS Feed
- Permalink
- Report Inappropriate Content
Thanks so much, I would really appreciate an example!
- Mark as New
- Bookmark Message
- Subscribe to Message
- Mute Message
- Subscribe to RSS Feed
- Permalink
- Report Inappropriate Content
Did you have a chance to test my example?

