- Splunk Answers
- :
- Using Splunk
- :
- Splunk Search
- :
- How to give Line break in eval and display the sam...
- Subscribe to RSS Feed
- Mark Topic as New
- Mark Topic as Read
- Float this Topic for Current User
- Bookmark Topic
- Subscribe to Topic
- Mute Topic
- Printer Friendly Page
- Mark as New
- Bookmark Message
- Subscribe to Message
- Mute Message
- Subscribe to RSS Feed
- Permalink
- Report Inappropriate Content
Hello,
I am trying to display some data in field "result" for me in a single value chart using below query, and color/severity rule is based on keywords instead of numbers. i.e. OK = GREEN and NOTOK = RED
Below code works for me but the only issue is I am unable to break the line in the chart.
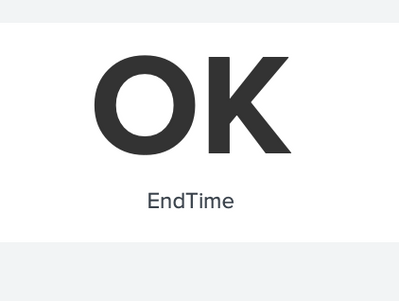
I want it as OK/NOTOK on the top and then the EndTime or anything that I may concatenate further below the result field.
Example,
============================================
result as "OK/NOTOK"
EndTime
============================================
I have tried using regex/sed or actually using (shift + enter) in my splunk query and it does works but in search only not in the dashboard.
Code
============================================
index=xyz | eval SLA=9.0
| eval Date=strftime(_time, "%m-%d-%y")
| eval EndTime=strftime(_time, "%H.%M")
| eval result=if(EndTime<SLA, "OK"."\n".EndTime, "NOTOK")
| table result EndTime
| eval severity=case(result="OK"." ".EndTime, 0, result="NOTOK", 1)
| rangemap field=severity low=0-0 default=severe
============================================
Can someone please advise ?
I had seen few posts that this could be achieved using some CSS/JS scripts but I do not have much knowledge on it.
Any help appreciated.
@niketn @ITWhisperer @Ayn @woodcock
Regards
- Mark as New
- Bookmark Message
- Subscribe to Message
- Mute Message
- Subscribe to RSS Feed
- Permalink
- Report Inappropriate Content
Singlevalue combine both again with comma separate. Here I suggest you go with below XML and try it.
<dashboard>
  <label>Single View Double Value</label>
  <row>
    <panel>
      <single>
        <search>
          <query>| makeresults | eval result="OK", result1="EndTime" | table result result1</query>
          <earliest>-24h@h</earliest>
          <latest>now</latest>
          <done>
            <set token="underlabel">$result.result1$</set>
          </done>
        </search>
        <option name="drilldown">none</option>
        <option name="underLabel">$underlabel$</option>
      </single>
    </panel>
  </row>
</dashboard>
Thanks
KV
▄︻̷̿┻̿═━一
If any of my reply helps you to solve the problem Or gain knowledge, an upvote would be appreciated.
- Mark as New
- Bookmark Message
- Subscribe to Message
- Mute Message
- Subscribe to RSS Feed
- Permalink
- Report Inappropriate Content
Not sure \n work but you can split value to make it same. Can you please try this?
| makeresults | eval result="OK"."\n"."EndTime"| eval result = split(result,"\n")
KV
- Mark as New
- Bookmark Message
- Subscribe to Message
- Mute Message
- Subscribe to RSS Feed
- Permalink
- Report Inappropriate Content
- Mark as New
- Bookmark Message
- Subscribe to Message
- Mute Message
- Subscribe to RSS Feed
- Permalink
- Report Inappropriate Content
Singlevalue combine both again with comma separate. Here I suggest you go with below XML and try it.
<dashboard>
  <label>Single View Double Value</label>
  <row>
    <panel>
      <single>
        <search>
          <query>| makeresults | eval result="OK", result1="EndTime" | table result result1</query>
          <earliest>-24h@h</earliest>
          <latest>now</latest>
          <done>
            <set token="underlabel">$result.result1$</set>
          </done>
        </search>
        <option name="drilldown">none</option>
        <option name="underLabel">$underlabel$</option>
      </single>
    </panel>
  </row>
</dashboard>
Thanks
KV
▄︻̷̿┻̿═━一
If any of my reply helps you to solve the problem Or gain knowledge, an upvote would be appreciated.
- Mark as New
- Bookmark Message
- Subscribe to Message
- Mute Message
- Subscribe to RSS Feed
- Permalink
- Report Inappropriate Content
@kamlesh_vaghela It worked like a charm, Thanks a lot for your help 🙂
- Mark as New
- Bookmark Message
- Subscribe to Message
- Mute Message
- Subscribe to RSS Feed
- Permalink
- Report Inappropriate Content
@kamlesh_vaghela Please advise ?

