Turn on suggestions
Auto-suggest helps you quickly narrow down your search results by suggesting possible matches as you type.
Showing results for
Splunk Search
Turn on suggestions
Auto-suggest helps you quickly narrow down your search results by suggesting possible matches as you type.
Showing results for
- Splunk Answers
- :
- Using Splunk
- :
- Splunk Search
- :
- Re: How to find total execution time for multiple ...
Options
- Subscribe to RSS Feed
- Mark Topic as New
- Mark Topic as Read
- Float this Topic for Current User
- Bookmark Topic
- Subscribe to Topic
- Mute Topic
- Printer Friendly Page
- Mark as New
- Bookmark Message
- Subscribe to Message
- Mute Message
- Subscribe to RSS Feed
- Permalink
- Report Inappropriate Content
How to find total execution time for multiple events?
din98
Explorer
07-25-2022
08:38 AM
Hey all,
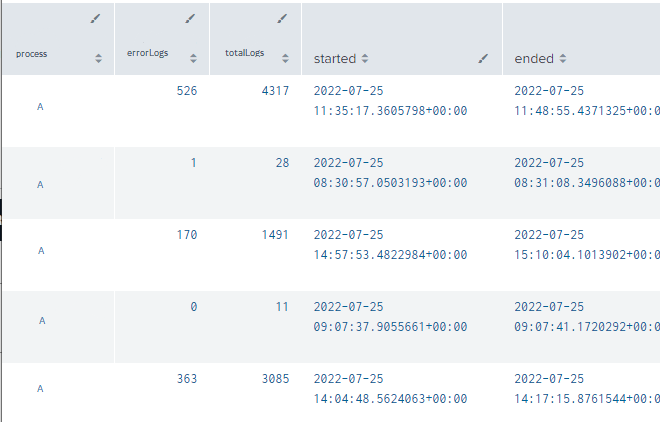
I have a summary table that shows these values. Each error log and log in the 'Total logs' column (which contains error logs and successful logs) have a unique timestamp.
| Process | Error logs | Total logs |
| A | 5 | 10 |
| B | 6 | 15 |
| C | 7 | 9 |
I want to find the total execution time for the error logs and the total logs for each process by adding the total execution times of the error/successful logs under each process. I am hoping to get a summary table like the one shown below.
| Process | Error logs | Total logs | Total execution time |
| A | 5 | 10 | 2 minutes |
| B | 6 | 15 | 50 seconds |
| C | 7 | 9 | 4 minutes |
Any help would be much appreciated. Thanks!
- Mark as New
- Bookmark Message
- Subscribe to Message
- Mute Message
- Subscribe to RSS Feed
- Permalink
- Report Inappropriate Content
ITWhisperer

SplunkTrust
07-26-2022
12:41 AM
| eval starttime=strptime(started,"%Y-%m-%d %H:%M:%S.%7Q%:z")
| eval endtime=strptime(ended,"%Y-%m-%d %H:%M:%S.%7Q%:z")
| eval duration=endtime-starttime
| stats sum(errorLogs) as errorLogs sum(totalLogs) as totalLogs sum(duration) as duration by process
| fieldformat duration=tostring(duration, "duration")- Mark as New
- Bookmark Message
- Subscribe to Message
- Mute Message
- Subscribe to RSS Feed
- Permalink
- Report Inappropriate Content
din98
Explorer
07-26-2022
06:58 AM
Hi @ITWhisperer,
I tried that query but the 'duration' column only shows blank fields.
- Mark as New
- Bookmark Message
- Subscribe to Message
- Mute Message
- Subscribe to RSS Feed
- Permalink
- Report Inappropriate Content
ITWhisperer

SplunkTrust
07-26-2022
07:29 AM
Please try this runanywhere example to see if the functions work in your environment
| makeresults
| eval started="2022-07-25 11:35:17.3605798+00:00"
| eval ended="2022-07-25 11:48:55.4371325+00:00"
| eval starttime=strptime(started,"%Y-%m-%d %H:%M:%S.%7Q%:z")
| eval endtime=strptime(ended,"%Y-%m-%d %H:%M:%S.%7Q%:z")
| eval duration=endtime-starttime
| fieldformat duration=tostring(duration,"duration")- Mark as New
- Bookmark Message
- Subscribe to Message
- Mute Message
- Subscribe to RSS Feed
- Permalink
- Report Inappropriate Content
din98
Explorer
07-25-2022
10:11 PM
- Mark as New
- Bookmark Message
- Subscribe to Message
- Mute Message
- Subscribe to RSS Feed
- Permalink
- Report Inappropriate Content
kamlesh_vaghela

SplunkTrust
07-25-2022
08:45 AM
@din98
Can you please share all sample events as well with the timestamp, error logs, and successful logs? This will be helpful to suggest proper solution.
KV
Can you please share all sample events as well with the timestamp, error logs, and successful logs? This will be helpful to suggest proper solution.
KV
Get Updates on the Splunk Community!
Extending Observability Content to Splunk Cloud
Watch Now!
In this Extending Observability Content to Splunk Cloud Tech Talk, you'll see how to leverage ...
More Control Over Your Monitoring Costs with Archived Metrics!
What if there was a way you could keep all the metrics data you need while saving on storage costs?This is now ...
New in Observability Cloud - Explicit Bucket Histograms
Splunk introduces native support for histograms as a metric data type within Observability Cloud with Explicit ...

