- Splunk Answers
- :
- Using Splunk
- :
- Splunk Search
- :
- Re: How to create an Alert that is triggered if th...
- Subscribe to RSS Feed
- Mark Topic as New
- Mark Topic as Read
- Float this Topic for Current User
- Bookmark Topic
- Subscribe to Topic
- Mute Topic
- Printer Friendly Page
- Mark as New
- Bookmark Message
- Subscribe to Message
- Mute Message
- Subscribe to RSS Feed
- Permalink
- Report Inappropriate Content
I have an alert that is looking when number of certain events go over a threshold per hour. For example if number of events is over 130 per hour, we would like a timechart to be emailed that has a breakdown of the events per 5 minute buckets.
So I created an alert from the following Splunk search:
index=main sourcetype=Auth Was_Degraded="true" | timechart span=5m count by host
And I set the alert to run once every hour and if number of events is over 130 to send an email. Unfortunately I never get alerted - I think what is happening is that Splunk is not looking at total number of events that were generated before it was passed to timechart - instead it looks at the output from timechart which is always 12 rows since span is set 5m. Thus the threshold of greater than 130 is never met.
I've been looking all over to see if there is a way to create this alert so that it is firing based on the total number of events generated by the first part of the search:
index=main sourcetype=Auth Was_Degraded="true"
and if it is above a threshold generate and email the timechart pdf which is needed for troubleshooting the problem.
- Mark as New
- Bookmark Message
- Subscribe to Message
- Mute Message
- Subscribe to RSS Feed
- Permalink
- Report Inappropriate Content
Change it to this, then:
index=main sourcetype=Auth Was_Degraded="true" | eventstats count AS totalCount BY host | where totalCount>130 | timechart span=5m count BY host
- Mark as New
- Bookmark Message
- Subscribe to Message
- Mute Message
- Subscribe to RSS Feed
- Permalink
- Report Inappropriate Content
Thanks that worked.
- Mark as New
- Bookmark Message
- Subscribe to Message
- Mute Message
- Subscribe to RSS Feed
- Permalink
- Report Inappropriate Content
Need to remove the first "BY host" for this to work - like this:
index=main sourcetype=Auth Was_Degraded="true" | eventstats count AS totalCount | where totalCount>130 | timechart span=5m count BY host
- Mark as New
- Bookmark Message
- Subscribe to Message
- Mute Message
- Subscribe to RSS Feed
- Permalink
- Report Inappropriate Content
I found out your solution during my research but the outputted chart/PDF is not the same as when used by timechart since it does not have breakdown by host.
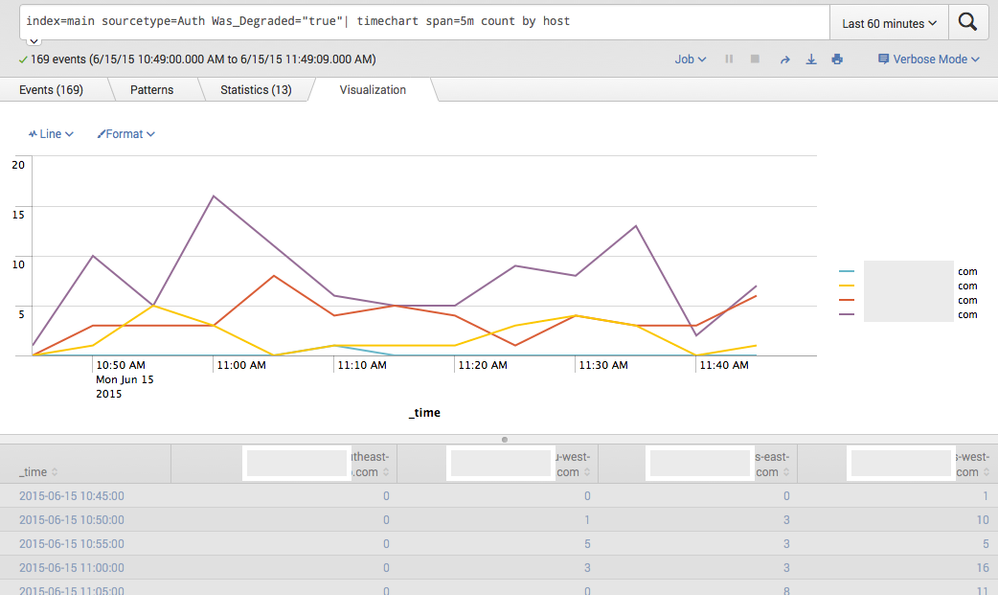
Here is what the chart should look like when used with a timechart query:
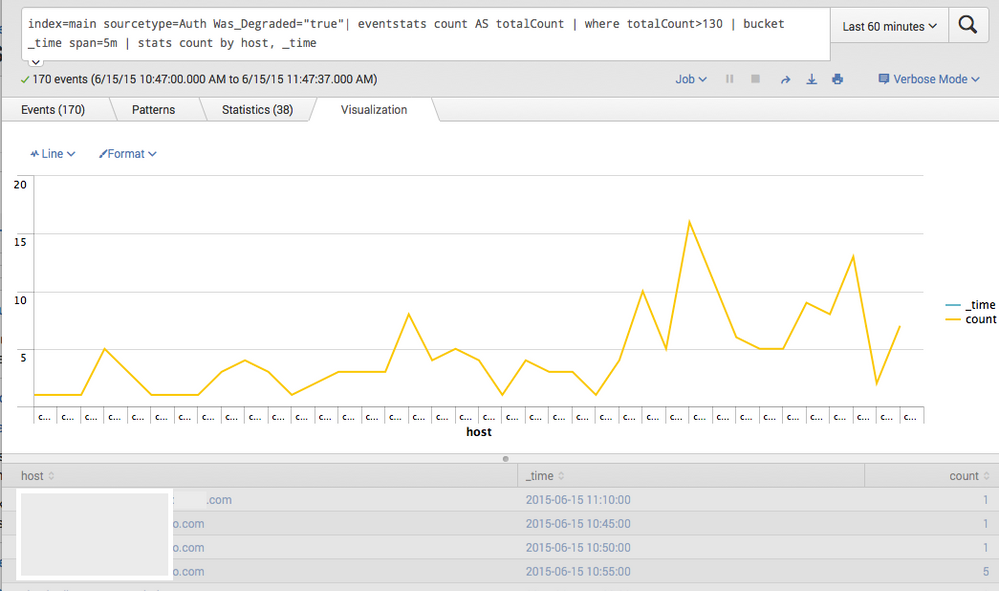
Here is what it looks like using stats and count by host - as you can see the breakdown is NOT by host but across all hosts:
- Mark as New
- Bookmark Message
- Subscribe to Message
- Mute Message
- Subscribe to RSS Feed
- Permalink
- Report Inappropriate Content
Try this:
index=main sourcetype=Auth Was_Degraded="true" | eventstats count AS totalCount | where totalCount>130 | bucket _time span=5m | stats count by host, _time
- Mark as New
- Bookmark Message
- Subscribe to Message
- Mute Message
- Subscribe to RSS Feed
- Permalink
- Report Inappropriate Content
Please look at my reply in as a separate answer - I could not comment on this answer and upload/attach pictures so I had to start a separate answer.
Could not get your solution to work with a breakdown by host.
- Mark as New
- Bookmark Message
- Subscribe to Message
- Mute Message
- Subscribe to RSS Feed
- Permalink
- Report Inappropriate Content
I blew that, try this:
index=main sourcetype=Auth Was_Degraded="true" | eventstats count AS totalCount BY host | where totalCount>130 | bucket _time span=5m | stats count by host, _time
- Mark as New
- Bookmark Message
- Subscribe to Message
- Mute Message
- Subscribe to RSS Feed
- Permalink
- Report Inappropriate Content
Great minds think alike 🙂
I thought of that and tried it before you suggestion but unfortunately that does not work either - Splunk returns the events but there is no statistics when you add the "BY host" clause on eventstats so there is nothing to chart
- Mark as New
- Bookmark Message
- Subscribe to Message
- Mute Message
- Subscribe to RSS Feed
- Permalink
- Report Inappropriate Content
Never mind my previous comment - I had a typo in the query that is why i was not seeing anything in the statistics window. After I fixed the typo I did get results in the statistics and visualization tab but it is still single line and not broken down by host.
- Mark as New
- Bookmark Message
- Subscribe to Message
- Mute Message
- Subscribe to RSS Feed
- Permalink
- Report Inappropriate Content
It should not return 0 when sorted by host (I do not believe that it does). Strip off everything after the last pipe character over-and-over until you get data that makes sense and then figure out why adding back on the piped clause breaks things. What I posted SHOULD work. The only thing that I can think that might be wrong is that the where clause is in the wrong place (but that still would not cause 0 events) like this:
index=main sourcetype=Auth Was_Degraded="true" | eventstats count AS totalCount BY host | bucket _time span=5m | stats count by host, _time,totalCount | where totalCount>130


