Join the Conversation
- Find Answers
- :
- Using Splunk
- :
- Splunk Search
- :
- How to compare results of a bar chart from two dif...
- Subscribe to RSS Feed
- Mark Topic as New
- Mark Topic as Read
- Float this Topic for Current User
- Bookmark Topic
- Subscribe to Topic
- Mute Topic
- Printer Friendly Page
- Mark as New
- Bookmark Message
- Subscribe to Message
- Mute Message
- Subscribe to RSS Feed
- Permalink
- Report Inappropriate Content
How to compare results of a bar chart from two different times
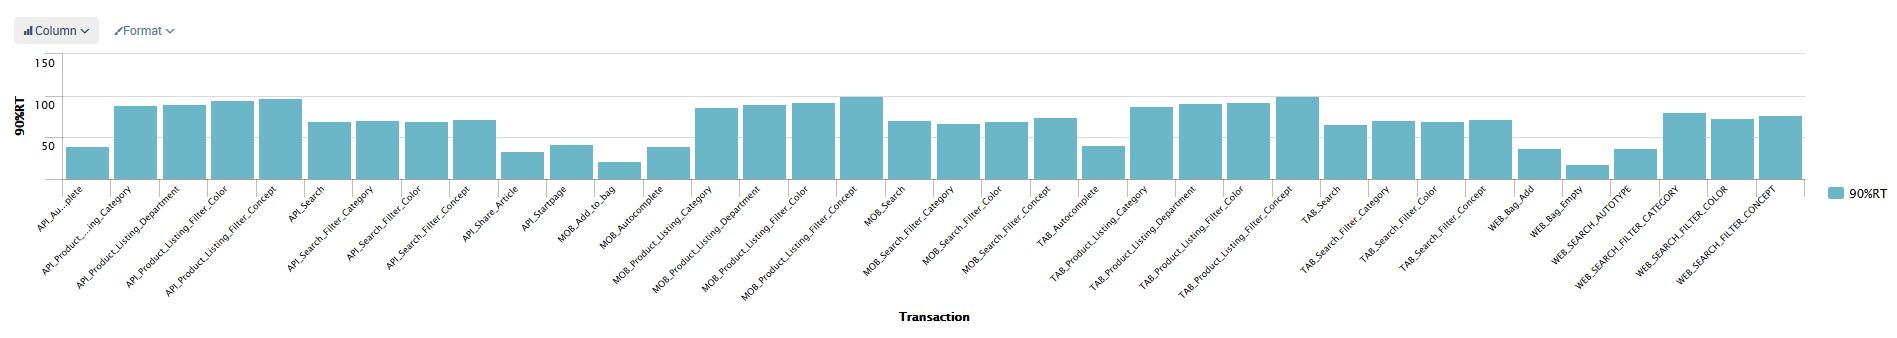
I have a search
index=* sourcetype=tsv Transaction=* Jmeter_measure="ok.pct90"| chart avg(Jmeter_RT_val) by Transaction | rename avg(Jmeter_RT_val) AS "90%RT" |sort Transaction

which shows average response times of different transaction during a test in a bar chart format.
I want to compare results from two different time periods (Different tests) say between (10:30 09 July 2015 to 11:30 09 July 2015 ) and (12:30 08 July 2015 to 13:30 08 July 2015 ) so that I can see if there something taking longer time than before. I would prefer them to be in different colors.
- Mark as New
- Bookmark Message
- Subscribe to Message
- Mute Message
- Subscribe to RSS Feed
- Permalink
- Report Inappropriate Content
This has been answered many times, just search for "Splunk timechart overlay". Any of these solutions should be workable:
http://answers.splunk.com/answers/122137/two-query-results-overlay-on-same-graph.html
http://answers.splunk.com/answers/12436/combine-searches-in-one-timechart.html
http://answers.splunk.com/answers/103229/timechart-overlay-multiple-strings.html
But in your case, you will have to add a time adjustment to one of your searches to have it "lie to Splunk" about when it happened so that the X-axis overlaps, just add the timeshift to the end of that search like this:
... | eval time=time+S0m3num83r
Congratulations to the 2025-2026 SplunkTrust!
[Puzzles] Solve, Learn, Repeat: Nested loops in Event Conversion
Your Guide to Splunk Digital Experience Monitoring
