Turn on suggestions
Auto-suggest helps you quickly narrow down your search results by suggesting possible matches as you type.
Showing results for
Splunk Search
Turn on suggestions
Auto-suggest helps you quickly narrow down your search results by suggesting possible matches as you type.
Showing results for
- Splunk Answers
- :
- Using Splunk
- :
- Splunk Search
- :
- Re: How to chart and compare memory usage of my JS...
Options
- Subscribe to RSS Feed
- Mark Topic as New
- Mark Topic as Read
- Float this Topic for Current User
- Bookmark Topic
- Subscribe to Topic
- Mute Topic
- Printer Friendly Page
- Mark as New
- Bookmark Message
- Subscribe to Message
- Mute Message
- Subscribe to RSS Feed
- Permalink
- Report Inappropriate Content
suarezry
Builder
01-26-2017
11:40 AM
I've got an interesting JSON:
{"timeStamp":"2017-01-26 23:59","name":"myVM1","counter":"mem.usage.average","description":"Memory usage as percentage of total configured or available memory","unit":"%","values":{"2017-01-26 10:00":"8.99","2017-01-26 09:55":"19.39","2017-01-26 09:50":"7.99"}}
{"timeStamp":"2017-01-26 23:59","name":"myVM2","counter":"mem.usage.average","description":"Memory usage as percentage of total configured or available memory","unit":"%","values":{"2017-01-26 10:00":"33.11","2017-01-26 09:55":"42.12","2017-01-26 09:50":"23.32"}}
The key is the timestamps. Can someone please provide the syntax to chart the two so I can compare memory usage? Thanks!
1 Solution
- Mark as New
- Bookmark Message
- Subscribe to Message
- Mute Message
- Subscribe to RSS Feed
- Permalink
- Report Inappropriate Content
somesoni2
Revered Legend
01-26-2017
12:08 PM
Assuming fields are all extracted, try like this
your base search | table name values* | untable name timestamp value | eval _time=strptime(timestamp,"values.%Y-%m-%d %H:%M") | timechart avg(value) by name
- Mark as New
- Bookmark Message
- Subscribe to Message
- Mute Message
- Subscribe to RSS Feed
- Permalink
- Report Inappropriate Content
suarezry
Builder
01-26-2017
01:54 PM
thank you! Exactly what I needed!
- Mark as New
- Bookmark Message
- Subscribe to Message
- Mute Message
- Subscribe to RSS Feed
- Permalink
- Report Inappropriate Content
javiergn
Super Champion
01-26-2017
12:04 PM
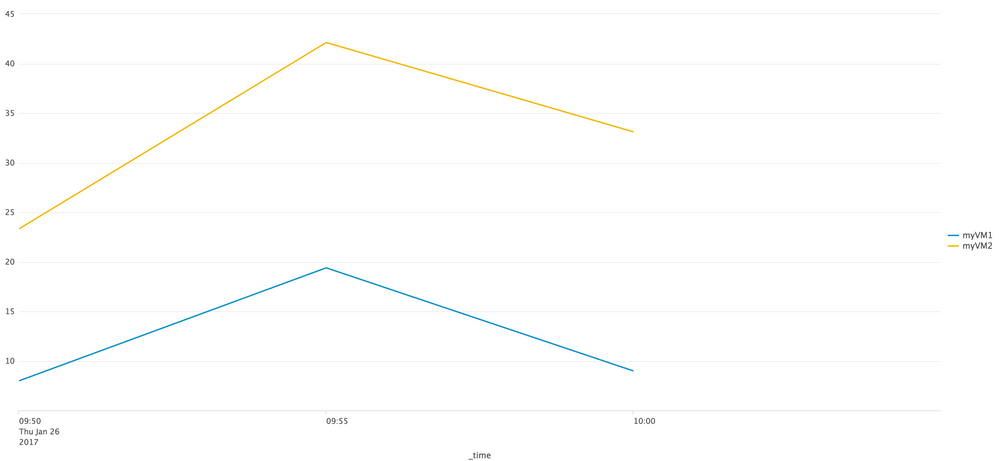
I've tried to replicate your question in my lab and I came up with the following. Let me know if it helps:
| makeresults
| fields - _time
| eval raw = "
    {\"timeStamp\":\"2017-01-26 23:59\",\"name\":\"myVM1\",\"counter\":\"mem.usage.average\",\"description\":\"Memory usage as percentage of total configured or available memory\",\"unit\":\"%\",\"values\":{\"2017-01-26 10:00\":\"8.99\",\"2017-01-26 09:55\":\"19.39\",\"2017-01-26 09:50\":\"7.99\"}}
    ;
    {\"timeStamp\":\"2017-01-26 23:59\",\"name\":\"myVM2\",\"counter\":\"mem.usage.average\",\"description\":\"Memory usage as percentage of total configured or available memory\",\"unit\":\"%\",\"values\":{\"2017-01-26 10:00\":\"33.11\",\"2017-01-26 09:55\":\"42.12\",\"2017-01-26 09:50\":\"23.32\"}}
"
| eval raw = split(raw, ";")
| mvexpand raw
| spath input=raw path=name output=name
| spath input=raw path=values output=timevalues
| rex field=timevalues max_match=0 "(?<pairs>\"\d{4}\-\d{2}\-\d{2} \d{2}\:\d{2}\"\:\"[\d\.]+\")"
| mvexpand pairs
| rex field=pairs "\"(?<time>\d{4}\-\d{2}\-\d{2} \d{2}\:\d{2})\"\:\"(?<value>[\d\.]+)\""
| eval _time = strptime(time, "%Y-%m-%d %H:%M")
| timechart span=5m first(value) as value by name
Output: see pictures below
- Mark as New
- Bookmark Message
- Subscribe to Message
- Mute Message
- Subscribe to RSS Feed
- Permalink
- Report Inappropriate Content
suarezry
Builder
01-26-2017
11:42 AM
Sorry, forgot to add that Splunk is already correctly parsing these events as JSON
- Mark as New
- Bookmark Message
- Subscribe to Message
- Mute Message
- Subscribe to RSS Feed
- Permalink
- Report Inappropriate Content
somesoni2
Revered Legend
01-26-2017
11:48 AM
Compare usage of both VMs at a give instance? The values contains multiple recording of memory usage, so you want to plot all of 3?
- Mark as New
- Bookmark Message
- Subscribe to Message
- Mute Message
- Subscribe to RSS Feed
- Permalink
- Report Inappropriate Content
suarezry
Builder
01-26-2017
11:51 AM
yes please, all three in a chart
Get Updates on the Splunk Community!
Webinar Recap | Revolutionizing IT Operations: The Transformative Power of AI and ML ...
The Transformative Power of AI and ML in Enhancing Observability
In the realm of IT operations, the ...
.conf24 | Registration Open!
Hello, hello! I come bearing good news: Registration for .conf24 is now open!
conf is Splunk’s rad annual ...
ICYMI - Check out the latest releases of Splunk Edge Processor
Splunk is pleased to announce the latest enhancements to Splunk Edge Processor.
HEC Receiver authorization ...


