- Splunk Answers
- :
- Using Splunk
- :
- Splunk Search
- :
- How do you make a table that reduces in height whe...
- Subscribe to RSS Feed
- Mark Topic as New
- Mark Topic as Read
- Float this Topic for Current User
- Bookmark Topic
- Subscribe to Topic
- Mute Topic
- Printer Friendly Page
- Mark as New
- Bookmark Message
- Subscribe to Message
- Mute Message
- Subscribe to RSS Feed
- Permalink
- Report Inappropriate Content
How to change a Simple XML table height when no data is present? The table should be much smaller when no alerts are triggered. Table need not be hidden to show any other custom message/panel. The table itself should be reduced in height.
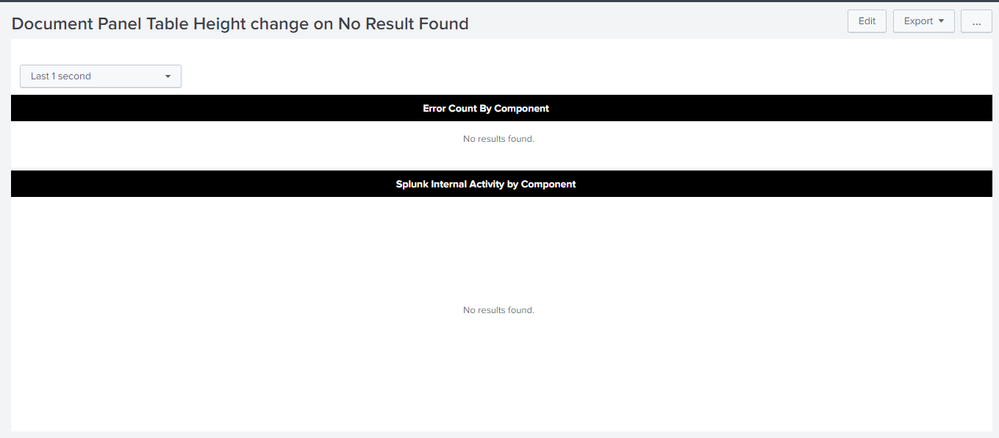
Attached is the screenshot of a Table with No Results Found, which consumes a lot of space.
PS: Documenting answer from Slack to Splunk Answers for future reference.
| makeresults | eval message= "Happy Splunking!!!"
- Mark as New
- Bookmark Message
- Subscribe to Message
- Mute Message
- Subscribe to RSS Feed
- Permalink
- Report Inappropriate Content
An ideal approach would be to use depends and rejects attributes based on token which is either set or unset depending upon results returned from search or no results case (through job.resultCount predefined Search Event Handler Token). Refer to Splunk Documentation: http://docs.splunk.com/Documentation/Splunk/latest/Viz/tokens#Search_tokens_for_dynamic_display_exam... Or Null Search Swapper example in the Splunk Dashboard Examples App.
However, since the ask is to display the table but reduce the height, similar approach will be used but instead of hiding the table and showing a custom panel, it will be used to apply custom CSS override.
Following run anywhere example uses:
1) A hidden <html> panel to apply CSS for dashboard. The tokens $tokHeight$ and $tokAlertInfoTop$, have been used to set the table height and push the No Result Found message a bit up in the table with reduced height.
          #myTable .splunk-table{
            $tokHeight$
          }
          #myTable .alert-info{
            $tokAlertInfoTop$
          }
2) The <done> Search Event Handler is used to access predefined Search Job token i.e. $job.resultCount$ which is 0 when No Results are returned and >0 otherwise. The tokens for CSS override are set accordingly, if no results are found, otherwise the tokens remain blank.
          <done>
            <condition match="$job.resultCount$==0">
              <set token="tokHeight">height: 50px !important;</set>
              <set token="tokAlertInfoTop">position:relative; top:-130px !important;</set>
            </condition>
            <condition>
              <set token="tokHeight"></set>
              <set token="tokAlertInfoTop"></set>
            </condition>
          </done>
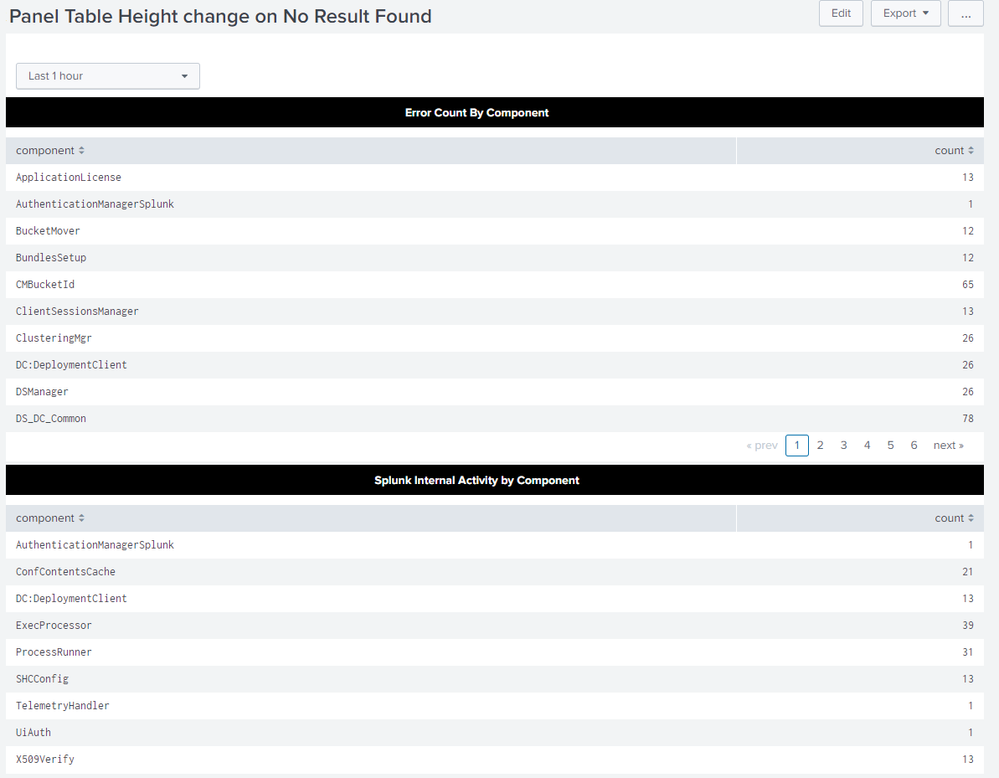
Table With Results
Table Without Results: Top Table for Error Count By Component has height reduced
Following is the complete Simple XML Code.
<form>
  <label>Panel Table Height change on No Result Found</label>
  <fieldset submitButton="false"></fieldset>
  <row depends="$alwaysHideCSSPanel$">
    <panel>
      <html>
        <style>
          .dashboard-row .dashboard-panel .panel-head h3{
            text-align:center !important;
            color:white !important;
            font-weight: bold !important;
            background:black !important;
          }
          #myTable .splunk-table{
            $tokHeight$
          }
          #myTable .alert-info{
            $tokAlertInfoTop$
          }
        </style>
      </html>
    </panel>
  </row>
  <row>
    <panel>
      <input type="time" token="tokTime" searchWhenChanged="true">
        <label></label>
        <default>
          <earliest>-1s@s</earliest>
          <latest>now</latest>
        </default>
      </input>
      <table id="myTable">
        <title>Error Count By Component</title>
        <search>
          <query>index=_internal sourcetype=splunkd log_level!=ERROR
| stats count by component</query>
          <earliest>$tokTime.earliest$</earliest>
          <latest>$tokTime.latest$</latest>
          <sampleRatio>1</sampleRatio>
          <done>
            <condition match="$job.resultCount$==0">
              <set token="tokHeight">height: 50px !important;</set>
              <set token="tokAlertInfoTop">position:relative; top:-130px !important;</set>
            </condition>
            <condition>
              <set token="tokHeight"></set>
              <set token="tokAlertInfoTop"></set>
            </condition>
          </done>
        </search>
        <option name="count">10</option>
        <option name="dataOverlayMode">none</option>
        <option name="drilldown">none</option>
        <option name="percentagesRow">false</option>
        <option name="rowNumbers">false</option>
        <option name="totalsRow">false</option>
        <option name="wrap">true</option>
      </table>
    </panel>
    </row>
    <row>
    <panel>
      <table>
        <title>Splunk Internal Activity by Component</title>
        <search>
          <query>index=_internal sourcetype=splunkd log_level!=INFO
| stats count by component</query>
          <earliest>$tokTime.earliest$</earliest>
          <latest>$tokTime.latest$</latest>
        </search>
        <option name="count">10</option>
        <option name="dataOverlayMode">none</option>
        <option name="drilldown">none</option>
        <option name="percentagesRow">false</option>
        <option name="rowNumbers">false</option>
        <option name="totalsRow">false</option>
        <option name="wrap">true</option>
      </table>
    </panel>
  </row>
</form>
| makeresults | eval message= "Happy Splunking!!!"
- Mark as New
- Bookmark Message
- Subscribe to Message
- Mute Message
- Subscribe to RSS Feed
- Permalink
- Report Inappropriate Content
I know it's lazy, but just adding this to your XML works (it just blindly resizes any DIV elements that contain the same class as the "No results found." and "Search did not return any events." messages on the page; the DIVs with results then "push" them to be taller):
  <row depends="$alwaysHideCSSPanel$">
     <panel>
       <html>
         <style>
            .msg {
              height:30px !important;
            }
            .splunk-viz-msg {
              height:30px !important;
            }
         </style>
       </html>
     </panel>
   </row>
However, if you do have other "message" panels in your dashboard, it will resize them as well.
,I know it's lazy, but just adding this to your XML works (it just blindly resizes the DIV elements that contain the "No results found." and "Search did not return any events." messages on the page):
  <row depends="$alwaysHideCSSPanel$">
     <panel>
       <html>
         <style>
            .msg {
              height:30px !important;
            }
            .splunk-viz-msg {
              height:30px !important;
            }
         </style>
       </html>
     </panel>
   </row>
However, if you do have other "message" panels in your dashboard, it will resize them as well.
- Mark as New
- Bookmark Message
- Subscribe to Message
- Mute Message
- Subscribe to RSS Feed
- Permalink
- Report Inappropriate Content
An ideal approach would be to use depends and rejects attributes based on token which is either set or unset depending upon results returned from search or no results case (through job.resultCount predefined Search Event Handler Token). Refer to Splunk Documentation: http://docs.splunk.com/Documentation/Splunk/latest/Viz/tokens#Search_tokens_for_dynamic_display_exam... Or Null Search Swapper example in the Splunk Dashboard Examples App.
However, since the ask is to display the table but reduce the height, similar approach will be used but instead of hiding the table and showing a custom panel, it will be used to apply custom CSS override.
Following run anywhere example uses:
1) A hidden <html> panel to apply CSS for dashboard. The tokens $tokHeight$ and $tokAlertInfoTop$, have been used to set the table height and push the No Result Found message a bit up in the table with reduced height.
          #myTable .splunk-table{
            $tokHeight$
          }
          #myTable .alert-info{
            $tokAlertInfoTop$
          }
2) The <done> Search Event Handler is used to access predefined Search Job token i.e. $job.resultCount$ which is 0 when No Results are returned and >0 otherwise. The tokens for CSS override are set accordingly, if no results are found, otherwise the tokens remain blank.
          <done>
            <condition match="$job.resultCount$==0">
              <set token="tokHeight">height: 50px !important;</set>
              <set token="tokAlertInfoTop">position:relative; top:-130px !important;</set>
            </condition>
            <condition>
              <set token="tokHeight"></set>
              <set token="tokAlertInfoTop"></set>
            </condition>
          </done>
Table With Results
Table Without Results: Top Table for Error Count By Component has height reduced
Following is the complete Simple XML Code.
<form>
  <label>Panel Table Height change on No Result Found</label>
  <fieldset submitButton="false"></fieldset>
  <row depends="$alwaysHideCSSPanel$">
    <panel>
      <html>
        <style>
          .dashboard-row .dashboard-panel .panel-head h3{
            text-align:center !important;
            color:white !important;
            font-weight: bold !important;
            background:black !important;
          }
          #myTable .splunk-table{
            $tokHeight$
          }
          #myTable .alert-info{
            $tokAlertInfoTop$
          }
        </style>
      </html>
    </panel>
  </row>
  <row>
    <panel>
      <input type="time" token="tokTime" searchWhenChanged="true">
        <label></label>
        <default>
          <earliest>-1s@s</earliest>
          <latest>now</latest>
        </default>
      </input>
      <table id="myTable">
        <title>Error Count By Component</title>
        <search>
          <query>index=_internal sourcetype=splunkd log_level!=ERROR
| stats count by component</query>
          <earliest>$tokTime.earliest$</earliest>
          <latest>$tokTime.latest$</latest>
          <sampleRatio>1</sampleRatio>
          <done>
            <condition match="$job.resultCount$==0">
              <set token="tokHeight">height: 50px !important;</set>
              <set token="tokAlertInfoTop">position:relative; top:-130px !important;</set>
            </condition>
            <condition>
              <set token="tokHeight"></set>
              <set token="tokAlertInfoTop"></set>
            </condition>
          </done>
        </search>
        <option name="count">10</option>
        <option name="dataOverlayMode">none</option>
        <option name="drilldown">none</option>
        <option name="percentagesRow">false</option>
        <option name="rowNumbers">false</option>
        <option name="totalsRow">false</option>
        <option name="wrap">true</option>
      </table>
    </panel>
    </row>
    <row>
    <panel>
      <table>
        <title>Splunk Internal Activity by Component</title>
        <search>
          <query>index=_internal sourcetype=splunkd log_level!=INFO
| stats count by component</query>
          <earliest>$tokTime.earliest$</earliest>
          <latest>$tokTime.latest$</latest>
        </search>
        <option name="count">10</option>
        <option name="dataOverlayMode">none</option>
        <option name="drilldown">none</option>
        <option name="percentagesRow">false</option>
        <option name="rowNumbers">false</option>
        <option name="totalsRow">false</option>
        <option name="wrap">true</option>
      </table>
    </panel>
  </row>
</form>
| makeresults | eval message= "Happy Splunking!!!"
- Mark as New
- Bookmark Message
- Subscribe to Message
- Mute Message
- Subscribe to RSS Feed
- Permalink
- Report Inappropriate Content
This solution doesn't work anymore. We're on Splunk Cloud version 9.0.2303.201. Hopefully it's just a simple update that's needed?
- Mark as New
- Bookmark Message
- Subscribe to Message
- Mute Message
- Subscribe to RSS Feed
- Permalink
- Report Inappropriate Content
Can you create a new question and refer to this as not working anymore?
- Mark as New
- Bookmark Message
- Subscribe to Message
- Mute Message
- Subscribe to RSS Feed
- Permalink
- Report Inappropriate Content
- Mark as New
- Bookmark Message
- Subscribe to Message
- Mute Message
- Subscribe to RSS Feed
- Permalink
- Report Inappropriate Content
For anyone else, if you're using an events table, replace ".splunk-table" with ".splunk-events-viewer".


