
Join the Conversation
- Find Answers
- :
- Using Splunk
- :
- Splunk Search
- :
- How do you make a chart with repeating x axis valu...
- Subscribe to RSS Feed
- Mark Topic as New
- Mark Topic as Read
- Float this Topic for Current User
- Bookmark Topic
- Subscribe to Topic
- Mute Topic
- Printer Friendly Page
- Mark as New
- Bookmark Message
- Subscribe to Message
- Mute Message
- Subscribe to RSS Feed
- Permalink
- Report Inappropriate Content
How do you make a chart with repeating x axis values?

Hi all,
I have 2 columns like that I want to plot:
x y
1579 1
1707 2
1707 3
1707 4
1707 5
1707 6
1707 7
1707 8
1707 9
1707 10
When I see the visualization with this search command:
source="splunk_test1.txt" host="Sriharshas-MacBook-Pro.local" sourcetype="temp" | table x, y | sort y
I get a plot like this:
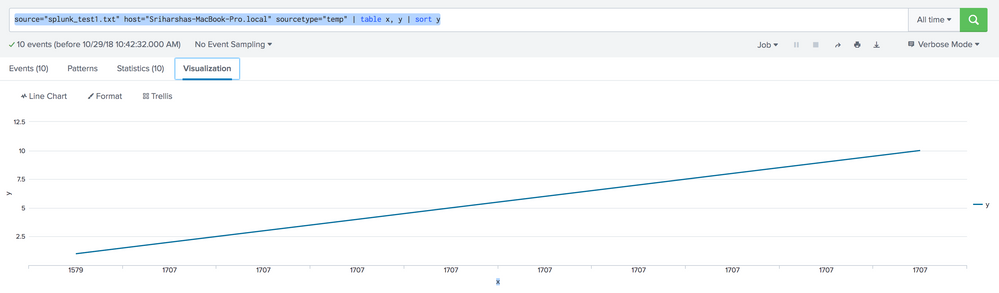
But I am looking for a plot like this:
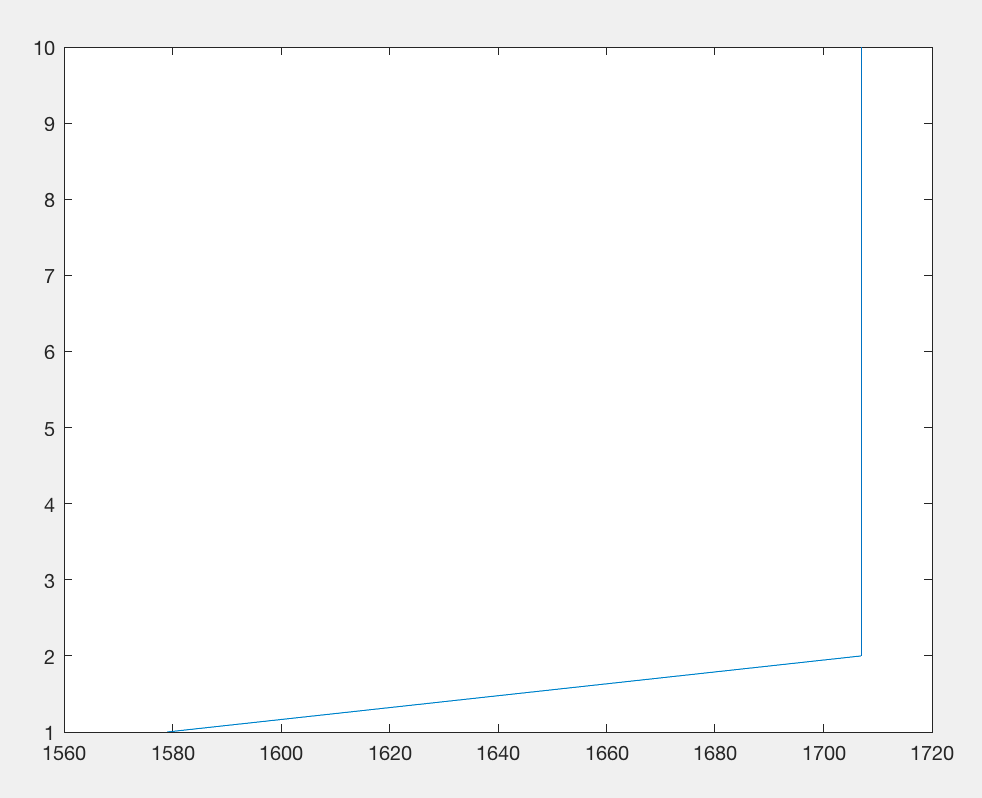
What should be my search command to get the required plot?
Thanks in advance!


- Mark as New
- Bookmark Message
- Subscribe to Message
- Mute Message
- Subscribe to RSS Feed
- Permalink
- Report Inappropriate Content


source="splunk_test1.txt" host="Sriharshas-MacBook-Pro.local" sourcetype="temp" | table x, y | sort y | stats max(x) by y
Instead of max(x), you could also try sum(x), depending on what that data represents
- Mark as New
- Bookmark Message
- Subscribe to Message
- Mute Message
- Subscribe to RSS Feed
- Permalink
- Report Inappropriate Content
This command:
source="splunk_test1.txt" sourcetype="temp" | table x, y | sort y | stats sum(x) as x1 by y | sort y
treats x1 as integer, but the plot is with x and y axis interchanged.
When I do this:
source="splunk_test1.txt" sourcetype="temp" | table x, y | sort y | stats sum(x) as x1 by y | sort y | table x1, y
I get the same plot as the one in the question.
It looks like, with repeating x-axis values (to generate a vertical line), the plotting routine changes the data type of the x-axis values.
I also tried this command to avoid repeating x-axis values:
source="splunk_test1.txt" sourcetype="temp" | table x, y | sort y | eval x = x+y
Even with this, I get the similar plot as the one in question

Join the Splunk Community Slack to learn, troubleshoot, and make connections with fellow Splunk practitioners in real time!
Join Splunk User Groups to connect and learn in-person by region or remotely by topic or industry.
[Puzzles] Solve, Learn, Repeat: Classic British Rock Bands
New to the Community? Join Us for an Exclusive Post .conf26 Welcome Session (Plus a ...
Accelerate Splunk App Development with AI
